There’s no guarantee that a given ETF will rise in value, as any number of market factors could lead to a decline. But whatever the market environment, it is crucial that the ETF is performing its role correctly. Investors should look at the key risk metrics for a given fund to see whether the ETF is truly “doing its job.” That can help determine whether it’s a hold, or if it’s time to sell and move on to a product more likely to meet their objective.
Beta
Beta is a measure of an ETF’s volatility relative to the market. By definition, the overall market’s Beta is 1.00. An ETF with a Beta greater than 1.00 has exhibited more volatility than the market over a specified period of time. In contrast, an ETF with a Beta less than 1.00 has been less volatile than the overall market.
Beta is also a function of correlation: An ETF with a positive Beta (greater than 0) is positively correlated with the overall market, whereas an ETF with a negative Beta (less than 0) is inversely correlated to the overall market. Most passive ETFs will have a positive Beta, while most active ETFs will have a negative Beta. Sectors that tend to exhibit high levels of volatility will have a positive Beta greater than 1, and more defensive sector ETFs will have a Beta that is positive but less than 1.
Examples of passive ETFs that may, depending on the market environment, have a negative Beta, include inverse ETFs (exchange traded funds that use derivatives to achieve the opposite returns of a specified benchmark), and government bond ETFs.
Standard Deviation
Standard Deviation compares the long-term average return of an investment to the shorter-term returns it achieved along the way. It’s common to look at the historical average returns of an investment when deciding if it’s a good opportunity. But average returns don’t tell the whole story. Suppose two ETFs both average a 7% return over the past 10 years. But when looking at individual years, one returned 7% every year while the other had some years with double-digit performance, and others with low single digit returns. Clearly, the ETF that rose 7% each year displayed lower volatility than its counterpart— and likely took less risk to achieve the same long-term return.
It’s crucial to note that Standard Deviation includes both upside and downside volatility. So, a high number could indicate increasing returns, decreasing returns, or a combination of both.
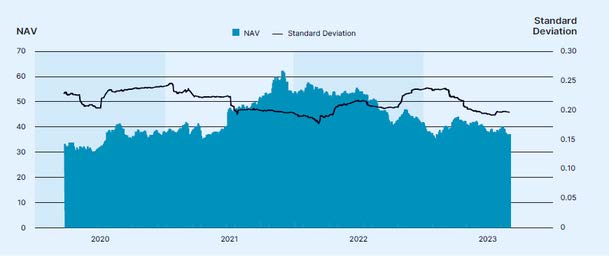
This graph is for illustrative purposes only and does not represent any specific investment
Alpha
A measure of how an ETF performs relative to a particular index or benchmark over a specified period of time, after adjusting for volatility. Alpha offers a window into the ‘active’ performance of an ETF, allowing investors to see whether a fund is outperforming or underperforming a passive benchmark. This measure is expressed as a percentage. For instance, an ETF with an Alpha of 3% will have exceeded its benchmark by this amount, after taking into account the volatility of the fund’s portfolio.
Sharpe Ratio
The Sharpe Ratio is a measure of an ETF’s excess returns relative to its volatility. The Sharpe Ratio indicates how much excess return is generated per unit of risk taken, and a higher number implies that an investor is being compensated for taking on extra risk with relatively outsized returns. The Sharpe Ratio gives investors a sense of whether an active ETF fund is taking a substantial amount of risk in order to generate outperformance. Ideally, an ETF is delivering above-average returns with low volatility. The Sharpe Ratio is also expressed numerically (the higher the better), with anything above 1 considered to be good.

ETFs can offer investors unique benefits through the interplay of primary and secondary markets, ensuring access, liquidity, and fair pricing.

ETFs offer a range of benefits that can make them an attractive investment option. To help ensure investors own the ETF that best fits their objectives, understanding the benefits of ETFs is key.

ETFs offer a range of benefits that can make them an attractive investment option. To help ensure investors own the ETF that best fits their objectives, understanding the benefits of ETFs is key.