
Over the holidays, I had the good fortune of discovering The Great Bridge, authored by famed historian David McCullogh in 1972. The Pulitzer Prize winner’s second book, an epic about the engineering and construction of the Brooklyn Bridge in the mid-to-late 19th century has stood the test of time, much like its subject. Completed in 1883, this bridge immediately became a symbol of innovation, progress and optimism, tying together two separate cities (New York and Brooklyn) into one – in spite of the era’s dark marks of rampant corruption, greed and selfishness. The author, who passed away at 89 in 2022, would often say of the historical time periods about which he wrote, “I wish I could’ve been there.”
Had Mr. McCullogh been available to write about equity markets in 2023, his ancient Royal typewriter would have spoken of the Magnificent Seven, Generative AI and GLP-1 drugs – all of which carry their own narratives of innovation, progress and optimism. Over the first 45 weeks of the year, these stocks and themes dominated market performance just as the Brooklyn Bridge soared alone across the skyline of the Big Apple’s Lower East Side 140 years ago.

Source: Library of Congress
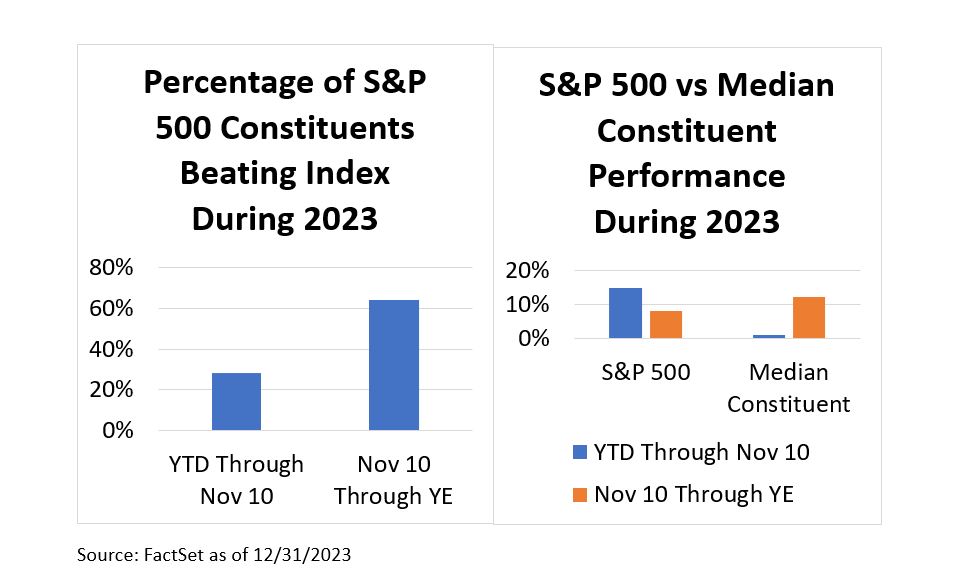
The final seven weeks of 2023, however, told a different story. During the last part of the year, nearly two-thirds of S&P 500® Index constituents beat the Index, compared to fewer than 30% during the first 45 weeks of the year. Additionally, over the final 33 trading days of 2023, the median S&P 500 Index constituent gained more than 12%; during the first 219 trading days, the median performer gained less than 1%.
Why, starting in mid-November, were investors suddenly eager to admire not just the Brooklyn Bridge equivalents within equities, but the Goethals, Throgs Neck and Hell Gate Bridges as well? Like Mr. McCullough, it appears as though equity investors are history buffs – and history tells us that U.S. equity investors make money once the Federal Reserve has completed a rate hiking cycle. The only recent exception to this perceived rule is the bursting of the dot-com bubble at the turn of this century. Typically, a Fed “pause” in rates would be followed by easing monetary policy, supporting an eventual acceleration of corporate earnings growth and thus market returns.
The question for investors today is whether this optimistic scenario is largely priced into valuations. At year-end, the S&P 500 Index traded at 19.5x forward P/E, above its pre-pandemic level of 18.9x (early February 2020) despite a 10-year U.S. Treasury yielding more than 200 basis points (bps) above levels from roughly four years ago. Additionally, the elevated valuation multiple is founded on an expectation of 11-12% EPS growth in 2024, at a time when near-term earnings expectations have been substantially lowered. At the end of 3q 2023, consensus expected year-over-year 4q 2023 S&P 500 Index EPS growth of more than 8%; today, that growth estimate stands at only 0.5%.
There remains uncertainty as to how the economy in 2024 will be impacted by 525 bps of U.S. rate hikes in recent years, how consumers will respond to an eventual depletion of excess pandemic savings, and whether an escalation of geopolitical conflicts around the globe incites another era of supply chain disruption and goods/resource inflation. Against those risks, the broad market rally of November-December looks more like a Pavlovian-type response to less onerous inflation data rather than a true “all clear” signal.
Yet, market timing is far from our core competency, and the longer-term outlook for U.S. equities remains bright with a new economic cycle likely to occur during our multi-year investment horizon. Our investment approach emphasizes quality business models and marries a near-term awareness of macro conditions with the longer-term principle of compounding value. While not every stock held in our strategies is as well recognized as the Brooklyn Bridge, each underlying business has been tested by our analyst team for its tensile strength and durability – such that it may both survive in the toughest of times and thrive otherwise.
Happy New Year, and remember to never skip a Beat - Eric
The views expressed are those of the author and Brown Advisory as of the date referenced and are subject to change at any time based on market or other conditions. These views are not intended to be and should not be relied upon as investment advice and are not intended to be a forecast of future events or a guarantee of future results. Past performance is not a guarantee of future performance and you may not get back the amount invested. The information provided in this material is not intended to be and should not be considered to be a recommendation or suggestion to engage in or refrain from a particular course of action or to make or hold a particular investment or pursue a particular investment strategy, including whether or not to buy, sell, or hold any of the securities mentioned. It should not be assumed that investments in such securities have been or will be profitable. To the extent specific securities are mentioned, they have been selected by the author on an objective basis to illustrate views expressed in the commentary and do not represent all of the securities purchased, sold or recommended for advisory clients. The information contained herein has been prepared from sources believed reliable but is not guaranteed by us as to its timeliness or accuracy, and is not a complete summary or statement of all available data. This piece is intended solely for our clients and prospective clients, is for informational purposes only, and is not individually tailored for or directed to any particular client or prospective client.
Terms and Definitions:
Forward P/E Ratio: The Forward P/E Ratio is determined by dividing the price of the stock by the company's forecasted earnings per share.
Estimated EPS Growth Rate: Estimated EPS Growth Rate is the forecasted growth rate of a company's earnings per share.
The S&P 500® Index, an unmanaged index, consists of 500 stocks chosen for market size, liquidity, and industry group representation. It is a market-value weighted index (stock price times number of shares outstanding), with each stock's weight in the Index proportionate to its market value.
Standard & Poor’s, S&P®, and S&P 500® are registered trademarks of Standard & Poor’s Financial Services LLC (“S&P”), a subsidiary of S&P Global Inc.
All financial statistics and ratios are calculated using information from FactSet as of the report date unless otherwise noted. FactSet® is a registered trademark of FactSet Research Systems, Inc.