
For most investors, optimizing portfolio allocation to maximize returns for a given risk level is crucial. This involves considering mixed asset classes, various securities and geographies, historical performance, correlation of returns and volatility.
For decades, it was widely accepted that smaller cap stocks outperformed larger ones over the long term due to the inherent inefficiencies of the asset class and the longer runway for growth. Historically, small caps were considered a higher-volatility, higher-return asset class that provided both diversification and return enhancement. However, recent years have challenged this premise, despite what we view as attractive valuations and solid fundamental performance in the sector.
In this article, we examine why we believe that U.S. small-cap stocks deserve attention today, despite their perceived increased risk and recent challenges.
The Evolution and Opportunity in Small-Cap Investing
Small-cap stocks, typically representing companies with market capitalizations ranging from $300 million to several billion dollars, have a rich history. Significant growth in small-cap investing occurred post-World War II with the rise of mutual funds and the advent of portfolio diversification theories, like Harry Markowitz’s Modern Portfolio Theory. The introduction of the Russell 2000® Index in the 1980s further facilitated small-cap exposure.
We believe that the vast U.S. market, characterized by innovation and entrepreneurial cultures, presents meaningful opportunities for active managers. By leveraging their expertise and research, skilled active managers can seize opportunities in this large and often inefficient market. Advances in technology and data availability have enabled improved research and analysis, and higher governance standards further reduce the risk profiles of U.S. small-caps vs. some other global peers.
The benefits of investing in small-cap companies are broad. First, they span a wide range of sectors and industries, providing early access to future mid- and large-cap businesses. Second, they can also offer a diversification boost, behaving differently from large caps and improving overall portfolio efficiency as part of a well-balanced account. This phenomenon has become more apparent in recent years as large-caps have become increasingly concentrated in areas such as technology while small-cap indices typically cover a broader range of sectors. Finally, over the long term, smaller companies typically tend to grow revenues and earnings faster than their larger counterparts.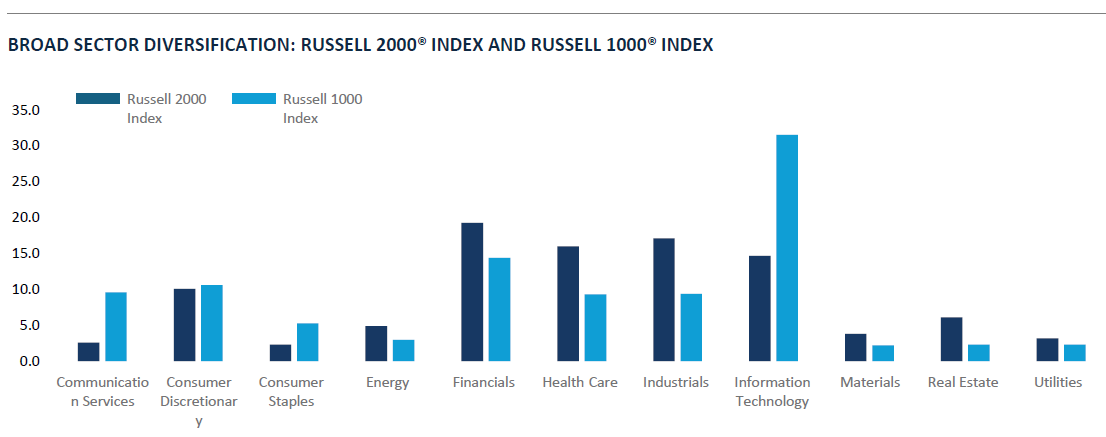
Source: FactSet. Sector weights shown as a percent as of 06/30/2025. Russell 2000 Index representing U.S. small caps and Russell 1000 Index representing U.S. large caps. Sectors are based on the Global Industry Classification Standard (GICS) classification system.
So Why Have Small Caps Been Left Behind?
U.S. small caps, as measured by the Russell 2000 Index, have not outperformed their large-cap counterparts in the Russell 1000® Index since 2016, marking the longest stretch of relative underperformance since the inception of the two indices in 1979.
Several factors explain the prolonged underperformance of small-cap stocks. One significant reason is their limited technology exposure. Large-cap indices have benefited immensely from leaders in software, cloud computing and AI, which dominate the S&P 500® Index. Technology represents just 14% of the Russell 2000, compared to over 30% for the S&P 500 and Russell 1000.
Additionally, small caps are typically more sensitive to rising interest rates due to their cyclical nature and greater exposure to sectors such as financials, industrials, real estate and consumer cyclicals. Many small-cap companies carry higher leverage, with nearly one-third of their debt being short term and at a floating rate, amplifying the impact of rising rates.
Finally, profitability concerns also play a role. The Russell 2000 has a significant proportion of unprofitable companies—more than 40% each year. This was particularly evident in the first half of 2024, as negative revisions to earnings per share (EPS) estimates compounded weak company performance, leading the Russell 2000 to underperform the S&P 500 by approximately 13%.1
Given the prevalence of these challenges, we believe active management is critical in this asset class. Skilled active managers have the ability to conduct rigorous fundamental analysis, distinguish sound businesses from weaker ones, and avoid potential pitfalls associated with excessive leverage or lack of profitability. By carefully selecting higher-quality companies with stronger balance sheets and durable earnings, active managers can better navigate the idiosyncratic risks inherent in the small-cap universe. A selective approach is especially important during periods of market stress or economic uncertainty, when weaker small-cap companies are most vulnerable, and when opportunities for alpha generation through disciplined active selection are greatest.
Is a Turnaround on the Horizon?
After experiencing a growth-led bubble in 2021 and subsequently enduring nearly three years of declining earnings, small-caps are now searching for solid ground. The current landscape is marked by extraordinary extremes: the combined market capitalization of the five largest companies in the S&P 500 is approximately five times greater than that of the entire Russell 2000 Index. Furthermore, the total market capitalization of the Russell 2000 now represents only about 5.5% of the S&P 500’s market cap, setting a new all-time low. Similarly, the Russell 2000’s share of the Russell 3000® Index has dropped to nearly 3%, a level not seen since the 1930s.
Despite these phenomena, small-cap absolute valuations appear to be hovering around their long-term averages. However, their relative valuation is becoming more compelling. According to the Jefferies small vs. large valuation model, small-caps currently sit in the 5th percentile (where 1 indicates the cheapest and 99 the most expensive), a level last seen in 2001. Additional data shown in the chart below also supports the view that U.S. small caps appear attractive relative to U.S. large-caps and other global peer groups.
Historically, U.S. small caps have rebounded swiftly during periods of improving economic and business conditions, often leading the market in periods of accelerating growth. Several factors can help drive such a turnaround, including monetary easing, changing sentiment and improving earnings. Small caps typically benefit from a shift to lower interest rates, which improves profitability and reduces financing costs. Attractive valuations coupled with improving earnings estimates, potential economic growth and lower interest expense, could support further upside for small-cap stocks.
In addition, due to lower liquidity and limited Wall Street analyst coverage, small caps are typically more susceptible to momentum-driven trading and shifts in sentiment. In the summer of 2024, when investor sentiment toward small caps had reached historic lows, the Fed signaled its first rate cut in September. This triggered a rotation into U.S. small caps, which posted strong gains in the back half of 2024, outperforming the S&P 500. It’s worth bearing in mind that current uneasiness is weighing on markets, inflation and other targets, which could arguably prolong uncertainty by the Fed for future rate cuts.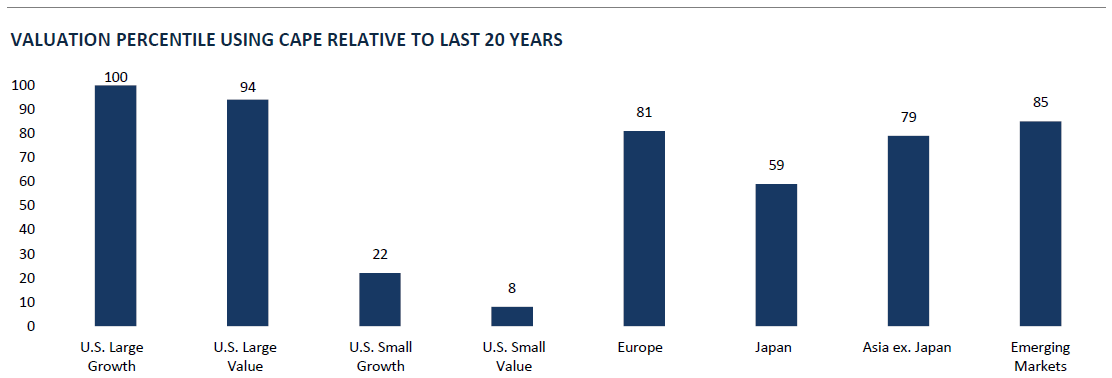
Source: Bloomberg, as of 06/30/2025. U.S. Large Growth using Russell 1000® Growth Index, U.S. Large Value using Russell 1000® Value Index, U.S. Small Growth using Russell 2000® Growth Index, U.S. Small Value using Russell 2000® Value Index, Europe using MSCI Europe USD Total Return Index, Japan using MSCI Japan USD Total Return Index, Asia ex. Japan using MSCI Asia ex. Japan USD Total Return Index, and Emerging Markets using MSCI Emerging Markets Net USD Total Return Index
Additionally, small caps are more tied to the U.S. economy, with only 20% of revenues derived from overseas compared to 40% for the S&P 500 Index. While this domestic focus better insulates them from global geopolitical risks, we should recognize the potential for slowing U.S. GDP growth, which could disproportionately impact smaller companies.2
Reshoring initiatives and investments in supply chain reliability could support a capital expenditure cycle favoring U.S.-focused small caps, which have historically led to higher revenue growth. Furthermore, as AI capital investment expands beyond large caps, small companies stand to benefit from technological advancements.
Another key dynamic affecting the U.S. small-cap universe is the number of initial public offerings (IPOs) in the market. While the rate of IPOs has slowed a little in recent years—with some companies choosing to stay private for longer due in part to abundant private capital—the rate of IPOs is inherently cyclical. Market conditions, investor sentiment, and economic outlook all play significant roles in determining the timing and volume of IPO activity. When the environment becomes favorable, as it often does during periods of accelerating growth and improving sentiment, a new wave of smaller, innovative, and dynamic companies comes to the public markets. In fact, public listings in Q1 2025 represented the largest share of private equity (PE) exit activity since 20213. This influx not only broadens the opportunity set but also creates fertile ground for active small-cap managers. We believe these managers are particularly well-positioned to identify and invest in the most promising new entrants, leveraging their research and flexibility to capture early-stage growth opportunities that may be overlooked by passive strategies.
Finally, increased merger and acquisition activity could provide another tailwind for the small-cap sector, offering additional opportunities for growth and value realization. Indeed, deal activity has steadily increased in each of the past five quarters through Q1 2025, with PE exits being driven by sales to financial buyers which now represent roughly half of all exits. As cycles turn, the combination of new public listings, technological advancement, and strategic corporate activity underscores the enduring potential of small-cap stocks in U.S. equity portfolios.
In Summary
Recognizing the uncertain and constantly changing environment, small caps can still offer diversification, growth potential and a wide array of opportunities, and we believe they deserve serious consideration as a part of overall U.S. equity exposure for long-term investors. A broadening of market leadership away from mega-cap stocks should provide additional support for small caps in 2025. As fundamental investors, our active and selective approach will always be on identifying opportunities at the company level with a focus on quality—specifically smaller companies with strong earnings, cash flow and recurring revenues.
Key attributes of small-cap investing: |
|
1. Source: Bloomberg, as of 06/28/2024
2. Source: London Stock Exchange Group, “How American is your US equity portfolio?”, as of 02/15/2024;
3. Source: PitchBook, “Q1 2025 US PE Breakdown”, as 03/31/2025
Disclosures
The views expressed are those of the author and Brown Advisory as of the date referenced and are subject to change at any time based on market or other conditions. These views are not intended to be and should not be relied upon as investment advice and are not intended to be a forecast of future events or a guarantee of future results. Past performance is not a guarantee of future performance, and you may not get back the amount invested.
The information provided in this material is not intended to be and should not be considered to be a recommendation or suggestion to engage in or refrain from a particular course of action or to make or hold a particular investment or pursue a particular investment strategy, including whether or not to buy, sell or hold any of the securities or funds mentioned. It should not be assumed that investments in such securities have been or will be profitable. To the extent that specific securities are mentioned, they have been selected by the author on an objective basis to illustrate views expressed in the commentary and do not represent all of the securities purchased, sold or recommended for advisory clients. This material is intended solely for our clients and prospective clients, is for informational purposes only and is not individually tailored for or directed to any particular client or prospective client.
The information contained herein has been prepared from sources believed reliable but is not guaranteed by us as to its timeliness or accuracy and is not a complete summary or statement of all available data. The information in this document has not been independently reviewed or audited by outside certified public accountants. The information provided is not intended to be a forecast of future events or a guarantee of future results. Past performance is not indicative of future performance.
The Russell 2000® Index measures the performance of the small-cap segment of the U.S. equity universe. The Russell 2000® Index is a subset of the Russell 3000® Index, representing approximately 10% of the total market capitalization of that index. It includes approximately 2000 of the smallest securities based on a combination of their market cap and current index membership. The index was developed with a base value of 140.00 as of December 31, 1986. The Russell 2000® Growth Index measures the performance of the small-cap growth segment of the U.S. equity universe. It includes those Russell 2000® Index companies with higher price-to-book ratios and higher forecasted growth values. The Russell 2000® Growth Index is constructed to provide a comprehensive and unbiased barometer for the small-cap growth segment. The Russell 2000® Value Index measures the performance of the small-cap value segment of the U.S. equity universe. It includes those Russell 2000® Index companies with lower price-to-book ratios and lower forecasted growth values. The Russell 2000® Value Index is constructed to provide a comprehensive and unbiased barometer for the small-cap value segment. The Index is completely reconstituted annually to ensure new and growing equities are included and that the represented companies continue to reflect value characteristics.
The Russell 1000® Index is a stock market index used as a benchmark by investors. It is a subset of the larger Russell 3000 Index and represents the top 1,000 companies by market capitalization in the United States. The Russell 1000® Growth Index measures the performance of the large-cap growth segment of the U.S. equity universe. It includes those Russell 1000® Index companies with higher price-to-book ratios and higher forecasted growth values. It is constructed to provide a comprehensive and unbiased barometer for the large-cap growth segment. The Index is completely reconstituted annually to ensure new and growing equities are included and that the represented companies continue to reflect growth characteristics. The Russell 1000® Value Index measures the performance of the large-cap value segment of the U.S. equity universe. It includes those Russell 1000 companies with lower price-to-book ratios and lower expected and historical growth rates. The Russell 1000® Value Index is constructed to provide a comprehensive and unbiased barometer for the large-cap value segment. The Index is completely reconstituted annually to ensure new and growing equities are included and that the represented companies continue to reflect value characteristics.
The Russell 3000® Index is a market capitalization weighted equity index maintained by the FTSE Russell that provides exposure to the entire U.S. stock market. The index tracks the performance of the 3,000 largest U.S.-traded stocks which represent about 98% of all U.S incorporated equity securities.
The Frank Russell Company (“Russell”) is the source and owner of the trademarks; service marks and copyrights related to the Russell Indexes. Russell ® is a trademark of Frank Russell Company. Neither Russell nor its licensors accept any liability for any errors or omissions in the Russell Indexes and/or Russell ratings, or underlying data and no party may rely on any Russell Indexes and/or Russell ratings and / or underlying data contained in this communication. No further distribution of Russell data is permitted without Russell’s express written consent. Russell does not promote, sponsor or endorse the content of this communication.
The S&P 500 Index, an unmanaged index, consists of 500 stocks chosen for market size, liquidity and industry group representation. It is a market-value weighted index (stock price times number of shares outstanding), with each stock's weight in the Index proportionate to its market value. Standard & Poor’s, S&P®, and S&P 500® are registered trademarks of Standard & Poor’s Financial Services LLC (“S&P”), a subsidiary of S&P Global Inc. The MSCI Europe Index captures large- and mid-cap representation across 15 Developed Markets (DM) countries in Europe*. With 417 constituents, the index covers approximately 85% of the free float-adjusted market capitalization across the European Developed Markets equity universe. The MSCI Japan Index is designed to measure the performance of the large and mid cap segments of the Japanese market. The index covers approximately 85% of the free float-adjusted market capitalization in Japan. The MSCI AC Asia ex Japan Index captures large and mid cap representation across Developed Markets (DM) countries (excluding Japan) and Emerging Markets (EM) countries in Asia. The index covers approximately 85% of the free float-adjusted market capitalization in each country. The MSCI Emerging Markets Index captures large- and mid-cap representation across 26 Emerging Markets (EM) countries. The index covers approximately 85% of the free float-adjusted market capitalization in each country. All MSCI indexes and products are trademarks and service marks of MSCI or its subsidiaries.
Factset® is a registered trademark of Factset Research Systems, Inc. Global Industry Classification Standard (GICS) and “GICS” are service makers/trademarks of MSCI and Standard & Poor’s. “Bloomberg®”, and the Bloomberg Indices used are service marks of Bloomberg Finance L.P. and its affiliates, including Bloomberg Index Services Limited (“BISL”), the administrator of the index (collectively, “Bloomberg”), and have been licensed for use for certain purposes by Brown Advisory. Bloomberg is not affiliated with Brown Advisory, and Bloomberg does not approve, endorse, review, or recommend Brown Advisory strategies. Bloomberg does not guarantee the timeliness, accurateness, or completeness of any data or information relating to Brown Advisory strategies.
CAPE Ratio is used to analyze a publicly held company’s long-term financial performance while considering the impact of different economic cycles on the company’s earnings.
Earnings per share (EPS) is a measure of a company's profitability, calculated by dividing quarterly or annual income (minus dividends) by the number of outstanding stock shares. The higher a company's EPS, the greater the profit and value perceived by investors.