
Volatility has returned to the capital markets in recent months. After several years of relative calm, investors have had renewed reason to worry about protecting their portfolios. Following the turmoil of the Great Recession, many market participants were lulled into complacency by seemingly steady gains in asset prices and the extended period of low interest rates. Looking back, it was these very factors that drew investors to riskier, more volatile asset classes, setting the stage for an inevitable return to risk aversion. The first quarter served as a vivid reminder of how nerve-wracking that transition can be, as stocks dropped sharply around the world in January and early February. Sufficient liquidity during periods like these can provide a measure of comfort amid the turbulence while enabling an investor to take advantage of opportunities as they arise.
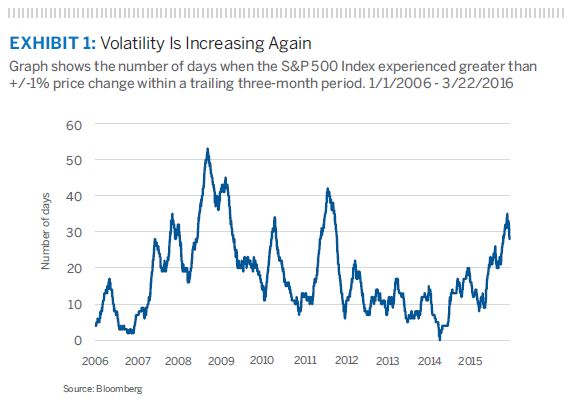
There are many ways to illustrate volatility, but one of the simplest is to add up the number of days in which a market moves up or down by more than a certain amount over a defined period of time. Using the Standard & Poor’s 500 Index as a market proxy, the chart below shows the number of daily price movements over 1% during each trailing three-month period since early 2006. As shown, the figure peaked at 52—more than 80% of the trading days in a 90-day period—in late 2008, not long before the market bottomed the following March. In the ensuing six years, this measure of volatility steadily declined, except for brief spikes in mid-2010 and late 2011. Over the next four years until last August, the number of 1%+ price changes in each 90-day period was consistently under 20.
Multiple Risks
Increases in volatility reflect, among other things, greater investor uncertainty about the outlook. At the risk of oversimplification, it seemed like most of the economic debate during the post-crisis period centered on two main concerns: the strength and durability of the U.S. recovery, and the timing of a move in monetary policy from quantitative easing to tightening. In contrast, investors today fear a greater variety of factors, both real and perceived:
- Declining commodity prices signaling economic weakness around the world, especially in countries that export raw materials. Oil stands out as the most visible barometer of weak demand, even though much of the problem is attributable to oversupply and the lack of a clear price leader.
- Slower growth in China, fear of an eventual hard landing and concern that China’s leaders are divided over economic policy.
- The lack of clarity around U.S. elections and sharp divisions within both political parties.
- The reality of a shift in Federal Reserve policy, in the form of the quarter-point increase in short-term interest rates, compounded by the uncertainty of how rapidly rates will be increased going forward.
- Uncertainty created by inexperience with negative interest rates, now being implemented in a number of countries, particularly in Europe. Nominal yields on shorter maturities of sovereign debt are negative in Germany and Japan, for example.
- Continued sluggish growth in the U.S. and around the globe, leaving less room for error in raising domestic interest rates. Some even worry that the Fed will have to move rates back down when it becomes clear that the earlier increase was premature and has jeopardized the fragile recovery.
- The cost and market disruption of unwinding quantitative easing and coping with the nearly $20 trillion U.S. debt burden during a period of rising interest rates.
Depending on one’s perspective and investment posture, this may be only a partial list, but the point is that the number of worries has multiplied, and with them, volatility. Of course, as a discounting mechanism, market prices adjust to take account of the risks. The question is whether prices overshot or are still catching up with reality. Market psychology tends to swing in a wider arc than underlying fundamentals, so we are inclined to think the current environment offers some compelling investment opportunities. To be sure, we are not suggesting that clients try to “time” the market. Instead, we caution against suddenly reacting to volatility and reiterate the imperative to focus on fundamentals and stay true to a portfolio structure that ensures adequate liquidity.
The Need for Cash
To take advantage of any investment opportunity, one must have sufficient cash reserves or be willing (and able, as we’ll see later) to liquidate a less attractive asset in order to invest in a more attractive one. But for many investors, having cash to meet everyday needs may be a more urgent consideration than taking advantage of opportunities. That is, under certain market conditions, it may be more important to sleep soundly at night than to dream fitfully about increasing one’s profits.
To help illustrate these trade-offs and manage risk, we adhere to what we call our “three-bucket” approach to portfolio construction. Of the three buckets, the "core portfolio" forms what is typically the largest, consisting of a portfolio of risk assets whose mix is relatively constant and intended to be strategic. The "opportunistic" bucket, in contrast, shifts over the course of a market cycle in order to take advantage of occasional dislocations or anomalies that present themselves. The "operating" bucket is essentially a highly liquid reserve intended to meet any and all needs for cash. In practice, all three buckets may be part of the same portfolio, but it’s useful to separate them conceptually.
In all market climates, but especially in volatile ones, we pay close attention to the operating bucket. Just as an endowment fund provides a cash stream to meet all or a portion of an institution’s operating expenses, a diversified portfolio helps fund the owner’s day-to-day cash requirements. Barring the need for a large lump-sum withdrawal, most clients’ cash requirements are reasonably predictable from period to period. While some clients satisfy their cash needs from the income generated by their portfolios, most subscribe to a “total return” approach, which involves occasionally selling securities to supplement the portfolio’s income stream, particularly when cash yields are low as they are now. The combination of income and cash raised through occasional sales supplies funds to the operating bucket or cash reserve.
Think of this cash reserve as a pail with a spigot at the bottom. The spigot stays open, allowing cash to run out to pay recurring expenses or fund other needs, while cash is added to the top of the bucket from dividend and interest income. Since the outflow normally exceeds income, the bucket must be resupplied from time to time. Instead of waiting until the last second to sell an asset—when prices may have declined—and refill the bucket, we recommend keeping it reasonably full at all times. That way, assets can be sold when it makes sense to—when prices present an opportunity— not when one is forced to.
This is the essence of the operating bucket, and we believe it’s a critical component of sensible portfolio management. As fundamental, bottom-up investors, we find that a long-term time horizon is often necessary for an investment to pay off, and we never want clients to be forced to sell before the opportune time arrives.
Opportunities
If the operating bucket is consistently and thoughtfully maintained, then the rest of the portfolio can be managed without regard to having to meet unexpected cash needs at disadvantageous times in the market. The core portfolio can “stay the course” and follow its long-term strategic plan. Moreover, timely opportunities to take advantage of changing conditions can be considered with relative objectivity. In hindsight, it would have been unfortunate to have needed to raise cash by selling stocks in early February. This is where the third, or opportunistic, bucket comes in.
Our Investment Solutions Group constantly monitors various markets and asset classes in an effort to spot opportunities arising from dislocations and to identify managers who are uniquely qualified to take advantage of them. Recommendations are intended to be implemented on the margin; that is, instead of moving, say, 20% of a U.S. equity portfolio from largecap stocks into small-cap stocks, the shift might be just a few percentage points. A recent example is high-yield bonds. Yields in this sector increased in the latter part of 2015 and earlier this year, widening their spread over U.S. Treasuries, whose yields fell during the same period. As a result, we have suggested that some clients allocate a small percentage of their balanced portfolios to high yield while slightly reducing their exposure to U.S. bonds and equities.
Making adjustments like these to portfolios is very different from trying to time the market by moving in and out. In general, we advise clients to stay fully invested—whatever that term implies in the context of each client’s unique circumstances, objectives and needs for cash. For some, it means adopting a core investment strategy and sticking with it unless one’s circumstances and objectives change for some reason. For others, it may mean dedicating a greater portion of the portfolio to opportunistic investments, taking advantage of occasional dislocations in the markets, such as high yield today. Most opportunistic investments are meant to be unwound at some point in the future, when the dislocation or anomaly has corrected. That way, flexibility is preserved.
Regardless of the weighting between a portfolio’s “core” and “opportunistic” components, it’s hard to avoid the volatility of recent times if one is fully invested. Diversification helps dampen portfolio fluctuations, but it’s less beneficial today than it was 20 or 30 years ago, when asset classes behaved more independently. Over the last 10 or 20 years, they have tended to move in concert, given the greater connectedness of world markets. Recently, for example, essentially all asset classes declined together, with the exception of quality bonds, particularly Treasuries, which are seen as a safe haven. And we’ve seen a tight correlation between oil prices and stocks over the last year or so.
What is Liquidity?
As we indicated above, taking advantage of opportunities—or just raising cash—involves having the ability to sell an asset in order to buy another. This consideration brings up the concept of liquidity and its importance in portfolios, particularly in declining markets.
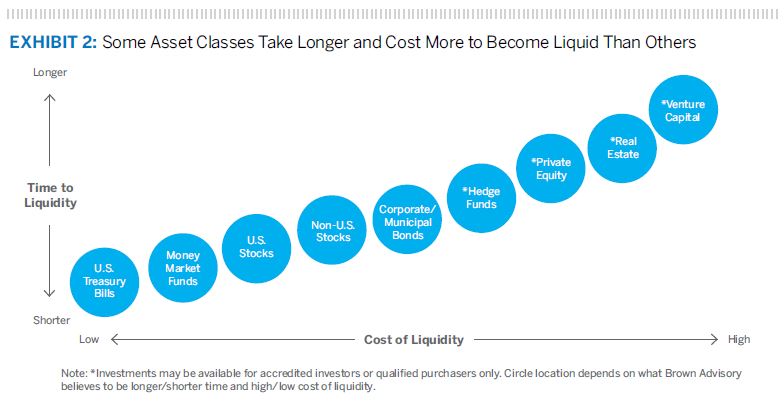
In a broad sense, if an asset is “liquid,” it is freely tradeable or, put another way, it can be converted into cash readily. There are, of course, degrees of liquidity. At one extreme are Treasury bills. Money market funds also behave like cash since—except in extremely rare instances of severe market stress—they always trade at $1.00 per share. (We generally recommend money funds invested in U.S. government securities so there’s virtually no risk of their trading at less than $1.00.) Thus, the fund can be sold one day and the cash delivered when ownership is transferred at settlement three days later, with no price risk. At the other extreme is a range of investment assets, including venture capital, various other types of private equity and real estate, in which the sales price is subject to considerable negotiation and therefore highly uncertain. Further, the time to closing can take months or even years. In between these bookends are stocks, bonds and other reasonably tradeable financial assets. These are normally able to be converted to cash in a few days, depending on the amount being sold, but the ultimate price is subject to market conditions and the strength of demand for the particular security at a point in time. Most stocks can be sold soon after an order is entered, and the proceeds are received in three days. Certain types of corporate or municipal bonds, on the other hand, may take a few days to trade, and the sales price—which is negotiated—is typically somewhat different from the last trade because the markets are less “continuous.”
Thus, the degree of liquidity of an asset can be conceptualized in terms of cost—how much of a discount in price is needed to effect a sale—and time—how long the sales process takes before cash is received. It’s important to note that these factors, particularly the price, cannot normally be known with certainty ahead of time. For example, we take for granted that a stock will be sold the same day as the order is entered and that the price will be very close to the last sale, but that’s not always the case. At the very time that you may wish to sell and raise cash, other people may have the same idea, and the price can change significantly.
The same phenomenon applies to mutual funds and can occasionally catch unsuspecting investors by surprise. Third Avenue’s Focused Credit Fund is an excellent case in point. This one-time $3.5 billion fund consisted of meaningful holdings in highly risky, relatively illiquid fixed income securities. As shareholders became concerned about the high-yield market last autumn, they began to redeem shares, compelling the fund to raise cash to meet the redemptions. Naturally, the fund looked to its most liquid securities as the main source of cash. As redemptions mounted, the fund was unable to raise sufficient cash because most of the remaining holdings could not readily be sold. In mid-December, it suspended redemptions altogether and announced a plan of liquidation of the fund, which will take a number of months. Partly for this reason, the Securities and Exchange Commission is considering forcing funds to hold more cash to meet possible withdrawals.
In similar fashion, during the financial crisis in 2008 and 2009, many hedge funds had little choice but to impose restrictions on redeeming limited partner interests, for fear that selling assets to meet redemptions would further depress the value of the fund’s investments for the remaining partners. These restrictions, termed “gates,” stretched out the time investors needed to turn their holdings into cash.
Many kinds of investments, then, may not be as liquid as they appear to be, either in terms of the time it takes to receive cash or the effective cost involved. Moreover, the cost of illiquidity rises dramatically in a declining market. For that reason, it’s important to pay careful attention to each asset’s liquidity characteristics in assembling a portfolio. Historically, less liquid assets have produced greater returns than highly liquid ones—i.e., one pays a price for liquidity by giving up some potential return. While many investors may be inclined to sacrifice liquidity in exchange for the prospect of higher profits, it’s critical to understand the implications of doing so.
If less liquid assets play an important role in one’s portfolio, the three-bucket philosophy is particularly useful. As we’ve pointed out, attempting to sell an illiquid asset when prices are declining will result in having to accept a large discount from market prices—if one can sell at all. Using our hedge fund example, it’s better to take advantage of occasional windows to redeem a partial interest in a fund rather than being subject to a gate when prices are down and other investors are also seeking liquidity. Having sufficient cash in the operating bucket allows one to allocate assets to less liquid investments that can add to returns in an environment still characterized by low interest rates.
In summary, we believe that liquidity is a vitally important factor in managing portfolio risk and return, and this is especially true during periods of market volatility, as we’ve seen recently. First, cash balances should be sufficient to meet reasonably anticipated needs so that assets do not have to be sold at depressed prices just to raise cash. More subtly, the liquidity characteristics of both core and opportunistic investments must be managed so there is enough flexibility to take advantage of market dislocations and changing conditions when they arise.
The views expressed are those of the author and Brown Advisory as of the date referenced and are subject to change at any time based on market or other conditions. These views are not intended to be a forecast of future events or a guarantee of future results. Past performance is not a guarantee of future performance. In addition, these views may not be relied upon as investment advice. The information provided in this material should not be considered a recommendation to buy or sell any of the securities mentioned. It should not be assumed that investments in such securities have been or will be profitable. To the extent specific securities are mentioned, they have been selected by the author on an objective basis to illustrate views expressed in the commentary and do not represent all of the securities purchased, sold or recommended for advisory clients or other clients. The information contained herein has been prepared from sources believed reliable but is not guaranteed by us as to its timeliness or accuracy, and is not a complete summary or statement of all available data. This piece is intended solely for our clients and prospective clients and is for informational purposes only. No responsibility can be taken for any loss arising from action taken or refrained from on the basis of this publication.
S&P 500 Index represents the large-cap segment of the U.S. equity markets and consists of approximately 500 leading companies in leading industries of the U.S. economy. Criteria evaluated include: market capitalization, financial viability, liquidity, public float, sector representation, and corporate structure. An index constituent must also be considered a U.S. company.