
Fast Reading:
- Fixed income benchmarks become concentrated through issuance rather than improving fundamentals, creating structural opportunities for active managers to manage concentration, credit, and duration risks more effectively.
- Because benchmarks are broadly inclusive and mechanically reflect issuer behaviour, passive fixed income exposure can embed unintended risks, such as rising leverage, deteriorating credit quality, or unfavourable shifts in duration.
- Global active fixed income offers a broad opportunity set, benefiting from dispersion in monetary policy, credit conditions, and economic cycles, allowing managers to construct more resilient, all‑weather portfolios aligned to client objectives.
Introduction
In the early 17th century, Miguel de Cervantes wrote Don Quixote and likely coined the metaphor: “don’t put all your eggs in one basket.” That instinct – to diversify, to avoid over-reliance on a single outcome – has become a powerful tailwind behind the growth of passive investing.
There is, however, a certain degree of irony, and perhaps a looming inflection point, in how that principle is being applied today. Passive exposure can represent a form of implicit concentration when market leadership narrows, particularly in equity markets where a small number of companies and themes can dominate index weights. At some point, the continued growth of passive investing may prove supportive of active management, but we will set that broader debate aside. Here we focus on a more practical question: whether fixed income benchmarks carry structural features that create enduring opportunities for skilled active managers.
In equities, concentration has increased meaningfully in parts of the market, driven largely by the massive scale of investment tied to the artificial intelligence (AI) ecosystem. We’re beginning to see how fragile this dynamic can be, as market volatility has become more sensitive to “wobbles” in the very companies perceived as AI beneficiaries – as well as those viewed as potential victims of disruption from this trend.
In fixed income, concentration arises through a different mechanism. Bond benchmarks become concentrated primarily through issuance, not through exceptional price appreciation of a few securities. In other words, more borrowing typically leads to larger benchmark weights and, by definition, an increase in leverage. Importantly, rising leverage can coincide with lower quality investment fundamentals, meaning the benchmark may systematically allocate more capital to the largest borrowers, regardless of whether those borrowers’ risk profiles are improving or weakening. This is an important reason we believe fixed income remains fertile ground for active management: it allows portfolios to be built around investor objectives, rather than the financing needs of issuers.
Fixed Income Active Management
Morningstar data on the actively-managed Global Flexible Bond category, relative to the Bloomberg Global Aggregate Index, suggests that a meaningful majority of managers have outperformed over multi-year horizons – more than 4 out of 5 managers on a trailing 5-year basis and more than 3 out of 5 managers on a trailing 10-year basis.1
When evaluating active versus passive in fixed income, we think it is useful to focus on three benchmark risks: concentration, credit, and duration.
- Concentration risk: Fixed income returns are asymmetric – upside is generally limited while downside can extend to default. In benchmarks, concentration risk is largely driven by the growth of debt issuance. The largest issuers are not necessarily the strongest credits, and increased issuance does not inherently signal improved fundamentals.
- Credit risk: Benchmarks are broadly inclusive. They hold most issuers regardless of credit cycle positioning, idiosyncratic challenges, or sector-level stress. Passive exposure therefore embeds a structural willingness to own issuers through deterioration, rather than selectively reallocating toward improving fundamentals.
- Duration risk: Benchmark duration is not designed around investors’ risk tolerances; it is a byproduct of issuance patterns and prevailing interest rates. Issuers often prefer long-duration issuance when rates are low or curves are flat. Separately, benchmark duration can extend as yields fall and shorten as yields rise, creating mechanical shifts to exposure that may or may not be desirable from a portfolio construction perspective.
We believe active management in fixed income enjoys structural advantages because managers can (1) manage concentration risk that is driven by issuance rather than value creation, (2) use fundamental research to allocate credit risk where compensation is attractive, and (3) manage duration deliberately, independent of issuer behaviour and benchmark mechanics.
Global Versus Local
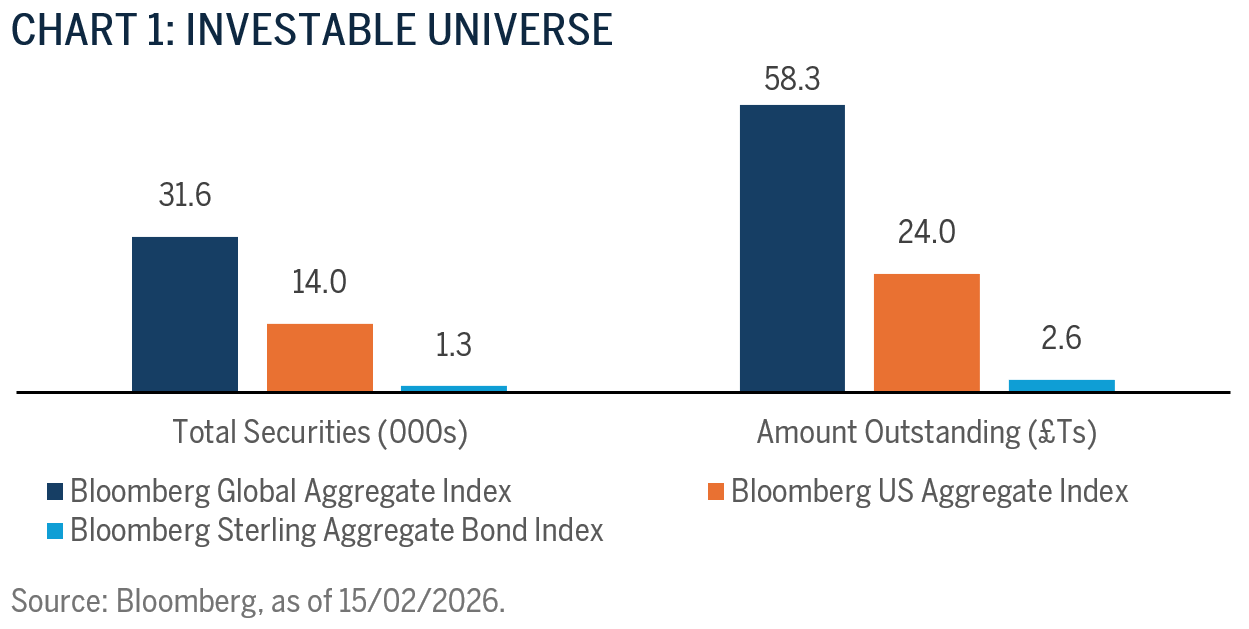
The breadth of the investable universe is also an important consideration in global fixed income. As of 31 December 2025, the Bloomberg Global Aggregate Index is substantially larger than domestic counterparts such as the U.K. index, in that case by more than twenty times (see Chart 1). Scale matters because it expands the investment opportunity set across sectors, issuers, and geographies.
A second advantage is macroeconomic diversification. Economic cycles, inflation and growth dynamics, policy regimes, regulatory environments, currency markets, and valuation frameworks can differ materially across developed and emerging markets at any given time. This dispersion creates opportunities for our investment process to express views through:
- Duration exposure in regions with looser monetary policy;
- Curve positioning that can benefit from monetary policies and changes in term premia – particularly where fiscal dynamics are influencing longer-dated yields (as has recently been evident in markets such as Japan, the U.K., and the U.S.);
- Broad asset allocation and idiosyncratic credit risk where fundamentals and valuations are aligned, and;
- Active currency risk where compensation is attractive and risk is intentional.
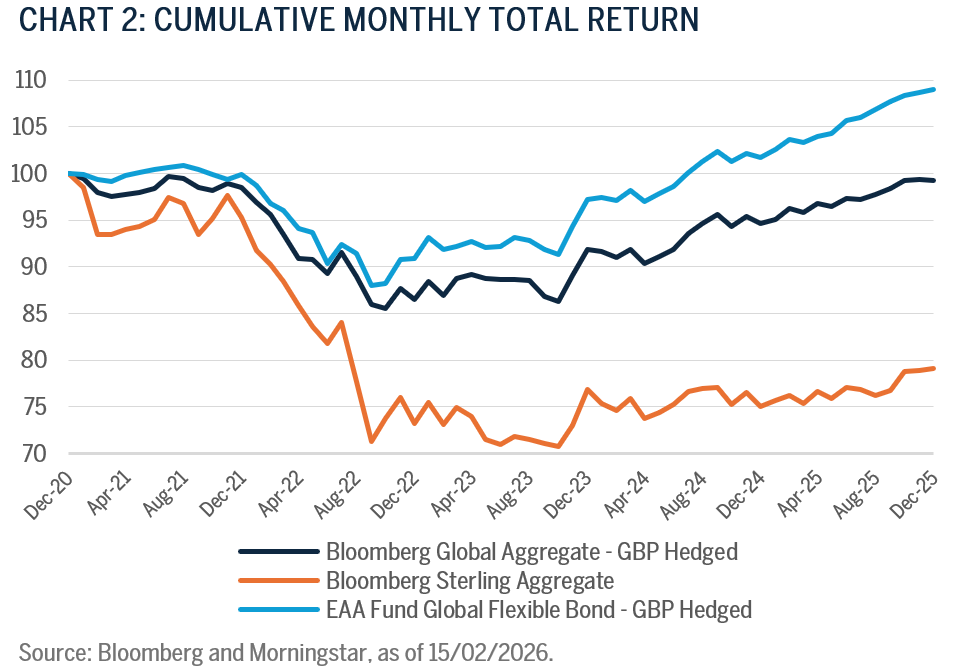
It is also worth considering the limitations of domestic-only investing. As illustrated in Chart 2, global active management (as represented by the Morningstar Global Flexible Bond category composite) has delivered strong relative returns versus the Bloomberg Global Aggregate Index, net of fees, over the trailing 5 years. More importantly, both global benchmarks and global active approaches have dramatically outperformed certain domestic markets – such as the U.K. – further underscoring the benefits of diversification.
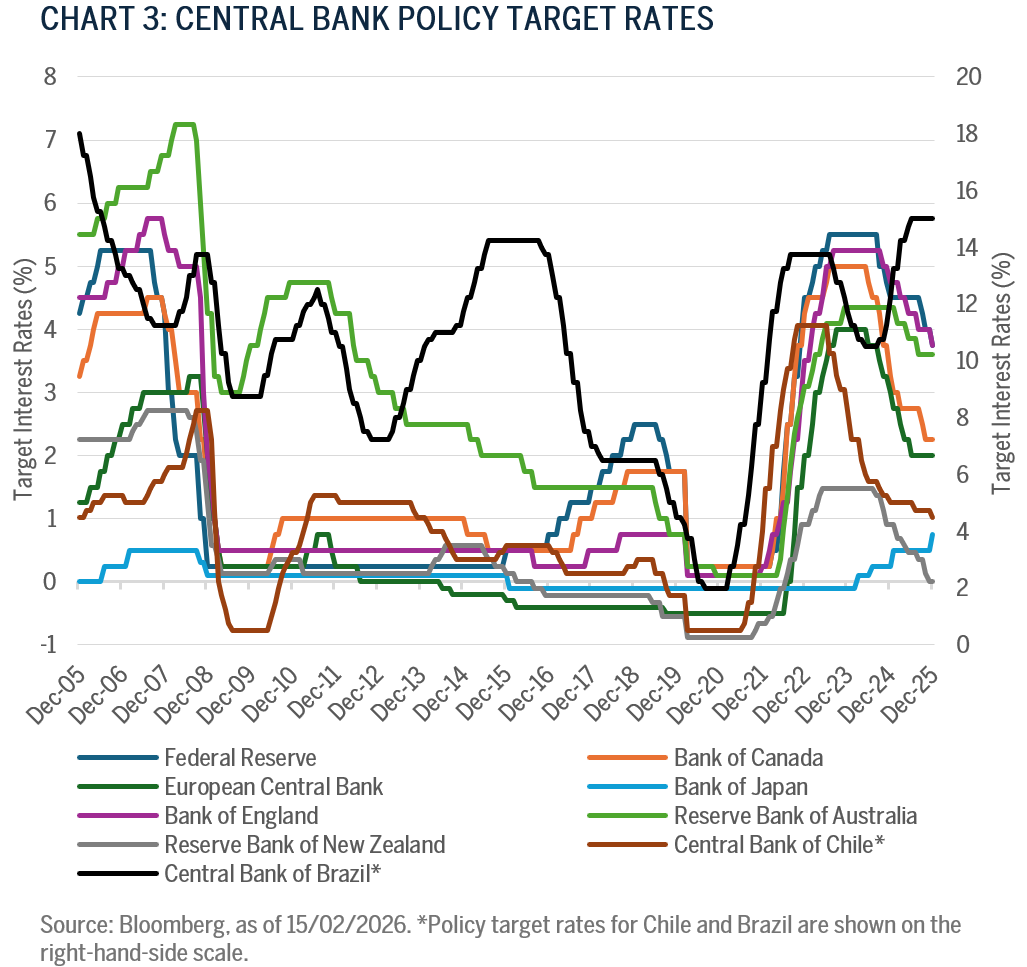
Finally, although critical, diversification is not simply about risk reduction, it is also about expanding opportunity. Chart 3 highlights divergent monetary policy regimes across a subset of developed and emerging markets – an instructive way to illustrate dispersion in economic cycles. This dispersion supports a core premise of global active management: the ability to allocate across different cycles to improve risk-reward, not merely to hold a broader set of securities.
Our Philosophy
While the case for active management in fixed income is compelling, a more important question is how outperformance is achieved. Potential drivers include duration posture, curve positioning, sector and regional allocation, credit selection, and active foreign exchange.
For us, the starting point is alignment: an investment philosophy that is explicitly designed around client objectives, implemented through a repeatable process. Our philosophy is grounded in dynamic portfolio management across the economic cycle, informed by the alignment of fundamentals and valuations at the intersection of top-down and bottom-up research. The objective is to provide risk-adjusted returns with bond-like characteristics through an economic cycle – by which we mean returns that are appropriately compensated for risk, while preserving the role that fixed income is meant to play as a counterbalance to equity risk, and other risks, inherent in multi-asset portfolios.
We often describe this as an all-weather, global bond portfolio.
We believe that the information ratio – as a measure of excess return per unit of active risk – can be a particularly relevant lens for assessing a fixed income manager’s effectiveness, given the asymmetry inherent in bond return profiles and the importance of managing downside.
And in the spirit of Cervantes: we have no interest in tilting at windmills. Our goal is not activity for its own sake, but disciplined, research-driven decisions that improve outcomes on behalf of our clients.
PORTFOLIO MANAGERS, GLOBAL SUSTAINABLE TOTAL RETURN BOND STRATEGY
Chris Diaz, CFA
Portfolio Manager
Ryan Myerberg
Portfolio Manager
Colby Stilson
Portfolio Manager
- Source: Morningstar, as of 15/02/2026. Data covers the trailing 5‑year period 01/31/2021 to 12/31/2025 and the trailing 10‑year period 01/31/2016 to 12/31/2025.
Disclosures
The views expressed are those of the author and Brown Advisory as of the date referenced and are subject to change at any time based on market or other conditions. These views are not intended to be and should not be relied upon as investment advice and are not intended to be a forecast of future events or a guarantee of future results.
Past performance is not a guarantee of future performance, and you may not get back the amount invested.
The information provided in this material is not intended to be and should not be considered to be a recommendation or suggestion to engage in or refrain from a particular course of action or to make or hold a particular investment or pursue a particular investment strategy, including whether or not to buy, sell or hold any of the securities or funds mentioned. It should not be assumed that investments in such securities have been or will be profitable. To the extent that specific securities are mentioned, they have been selected by the author on an objective basis to illustrate views expressed in the commentary and do not represent all of the securities purchased, sold or recommended for advisory clients. This material is intended solely for our clients and prospective clients, is for informational purposes only and is not individually tailored for or directed to any particular client or prospective client.
The information contained herein has been prepared from sources believed reliable but is not guaranteed by us as to its timeliness or accuracy and is not a complete summary or statement of all available data. The information in this document has not been independently reviewed or audited by outside certified public accountants. The information provided is not intended to be a forecast of future events or a guarantee of future results. Past performance is not indicative of future performance.
Terms and Definitions:
Credit risk is the risk that an issuer fails to make scheduled interest or principal payments in full and on time, potentially resulting in loss of value for bondholders. It increases as issuer fundamentals deteriorate (for example, rising leverage or weakening cash flows) and is embedded in broad bond benchmarks that include issuers regardless of changes in credit quality.
Duration is calculated as one over the portfolio turnover rate for the last 12 months, which shows on average the time in years that a manager holds a typical investment in the portfolio.
Excess return is the return of an investment relative to the return of a specified benchmark. It measures how much value has been added or detracted compared to the benchmark’s performance over the same period. It may also be referred to as active return.
Information ratio is the measure of the risk-adjusted return of a portfolio defined as expected active return divided by tracking error, where active return is the difference between the return of the portfolio and the return of a selected benchmark index, and tracking error is the standard deviation of the active return.
Term premia is the additional yield investors require for holding longer‑maturity bonds instead of rolling shorter‑maturity debt, reflecting uncertainty about inflation and interest rates.
Total return is the overall return of an investment, combining both price movement and income received (such as coupon or dividend payments) over a given period. It reflects the sum of all sources of return attributable to the security or portfolio, assuming the reinvestment of income.
The yield curve is a line that plots yields, or interest rates, of bonds that have equal credit quality but differing maturity dates. The slope of the yield curve can predict future interest rate changes and economic activity.
“Bloomberg®” and the Bloomberg indices used in this presentation are service marks of Bloomberg Finance L.P. and its affiliates, including Bloomberg Index Services Limited (“BISL”), the administrator of the index (collectively, “Bloomberg”) and have been licensed for use for certain purposes by Brown Advisory. Bloomberg is not affiliated with Brown Advisory, and Bloomberg does not approve, endorse, review, or recommend any Brown Advisory products. Bloomberg does not guarantee the timeliness, accurateness, or completeness of any data or information included in this written content. An investor cannot invest directly in an index.
The Bloomberg Global Aggregate Index is a measure of global investment‑grade debt from developed and emerging markets, including government, government‑related, corporate, asset‑backed, mortgage‑backed and commercial mortgage‑backed securities.
The Bloomberg Global Aggregate Index (1–10Y) (GBP Hedged) represents a close estimation of the performance that can be achieved by hedging the currency exposure of its parent index, the Bloomberg Global Aggregate Bond Index, to GBP. The index is 100% hedged to the GBP by selling the forwards of all the currencies in the parent index at the one‑month forward rate. The parent index is composed of government, government-related and corporate bonds, as well as asset-backed, mortgage-backed and commercial mortgage-backed securities from both developed and emerging markets issuers.
The Bloomberg Global Aggregate Index (GBP Hedged) represents a close estimation of the performance that can be achieved by hedging the currency exposure of the Bloomberg Global Aggregate Bond Index to sterling (GBP). The index is 100% hedged to GBP by selling forward contracts on all non‑GBP currencies in the parent index at the one‑month forward rate. The parent index includes investment‑grade government, government‑related, corporate, asset‑backed, mortgage‑backed, and commercial mortgage‑backed securities from developed and emerging markets issuers.
The Bloomberg U.S. Aggregate Bond Index is an unmanaged, market‑value‑weighted index comprised of taxable U.S. investment‑grade, fixed‑rate bond market securities, including government, government agency, corporate, asset‑backed, and mortgage‑backed securities between one and 10 years.
The Bloomberg Sterling Aggregate Bond Index measures the investment‑grade, sterling‑denominated, fixed‑rate bond market. The index includes U.K.‑denominated treasuries, government‑related securities, corporate bonds, and securitized issues. Eligibility is based on sterling (GBP) currency denomination rather than the issuer’s country of risk.
Morningstar, Inc. is an independent investment research provider whose proprietary tools, data, ratings, and category classifications are used to evaluate and compare investment products. Morningstar®, Morningstar Category, Morningstar Rating, Morningstar Risk, Morningstar Return, and Morningstar Style Box are trademarks of Morningstar, Inc. All Morningstar data and information are proprietary, may not be copied or distributed, and are not guaranteed to be accurate, complete, or timely. Past performance is not a guarantee of future results.
The Morningstar Global Flexible Bond Category represents actively‑managed global bond strategies that have the flexibility to invest across regions, sectors, currencies, and duration profiles. Category characteristics and peer group returns are defined and maintained by Morningstar, Inc. Managers voluntarily provide data to Morningstar, and category analytics may change as underlying data is updated. Morningstar does not guarantee the accuracy or completeness of category data, and past performance is not indicative of future results.