
The 151st running of the Kentucky Derby took place on the first Saturday of May, at the famed Churchill Downs Racetrack in Louisville. The event – one of the longest continually held sporting events in America and considered one of the nation’s most prestigious horse races – carries the long-standing traditions of wearing bright and elegant attire, the serving of sweet and syrupy Mint Juleps, and the devouring of gooey and chocolatey Derby Pies. The 1.25 mile, twenty-horse derby has been labeled “the fastest two minutes in sport”, although the winning Thoroughbred this year, Sovereignty crossed the finish line slightly beyond the two-minute mark. A rain-soaked day transformed the fast, dirt track into a surface perhaps best described as “peanut butter”.
The official term for the track’s condition is “sloppy” – saturated from rain, with standing water visible. The track and field equivalent would be attempting to run a lap on deep, soft sand. In the case of the derby, a sloppy track changes the complexion of the race; stamina/endurance likely plays a more significant role in determining success, as does the ability to cope (for both jockey and horse) with the adversity of slipping and having mud sprayed everywhere.
Following a two-year stretch where the S&P 500® Index’s cumulative total return was nearly 60%, the US equity market has encountered what could easily be described as “sloppy” conditions in 2025. With a furious rally since entering bear market territory in early April, the S&P 500 Index is slightly positive for the year as of May 16. Yet, capital allocators have debated an “appropriate” exposure level to US equities due to uncertainty surrounding policy and the potential economic impact over both the near and medium-term. The US credit downgrade by Moody’s on May 16 further complicates the backdrop.
While March-quarter earnings season has been reasonably well received by investors as a function of the resilient, affluent US consumer and a seemingly manageable net tariff impact on earnings per share (EPS), most companies are challenged to provide a precise outlook for the coming quarters. Later on, we’ll provide quotes directly from the “horses’ mouths” regarding broad themes from quarterly earnings calls. Yet investors and corporations alike are in “wait and see” mode – whether it be related to trade negotiations or the impact of higher prices on consumer demand. For these reasons it’s likely wise to take consensus earnings estimates for the remainder of this year with a grain of salt.
Regardless of the track conditions the goal for active equity managers remains consistent – generate alpha over multi-year periods and through economic cycles. For the past few years, it’s been challenging for large-cap core and growth managers to keep up with the pace of the benchmark (S&P 500 Index and Russell 1000® Growth Index, respectively). A small group of companies generated the majority of market returns, and index concentration reached levels we simply had not experienced previously. During 2023 and 2024, only a fraction of S&P 500 Index constituents outperformed the Index. As such, most active equity managers in these style boxes underperformed on a relative basis. However, thus far in 2025 track conditions have changed, providing the opportunity for many active managers to “launch a rally”. As of May 16, 55% of constituents in the S&P 500 Index have outperformed year-to-date – a considerably higher level than for most of the past decade. In addition, for the first time in at least ten years, the majority of large-cap growth managers are outperforming their respective benchmark thus far in 2025, per public Morningstar data.
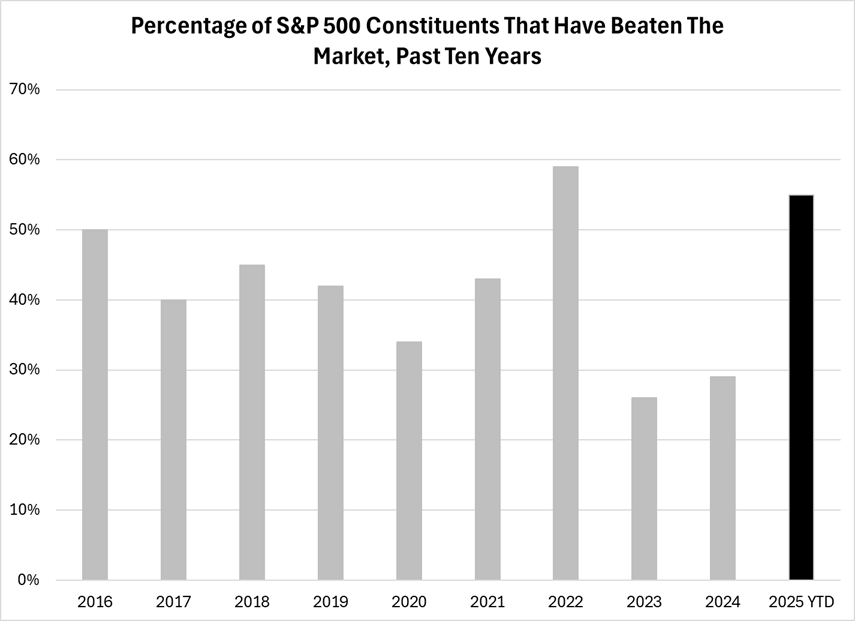
Note: 2025 YTD data as of May 16. Source: Morningstar, Bloomberg and FactSet.
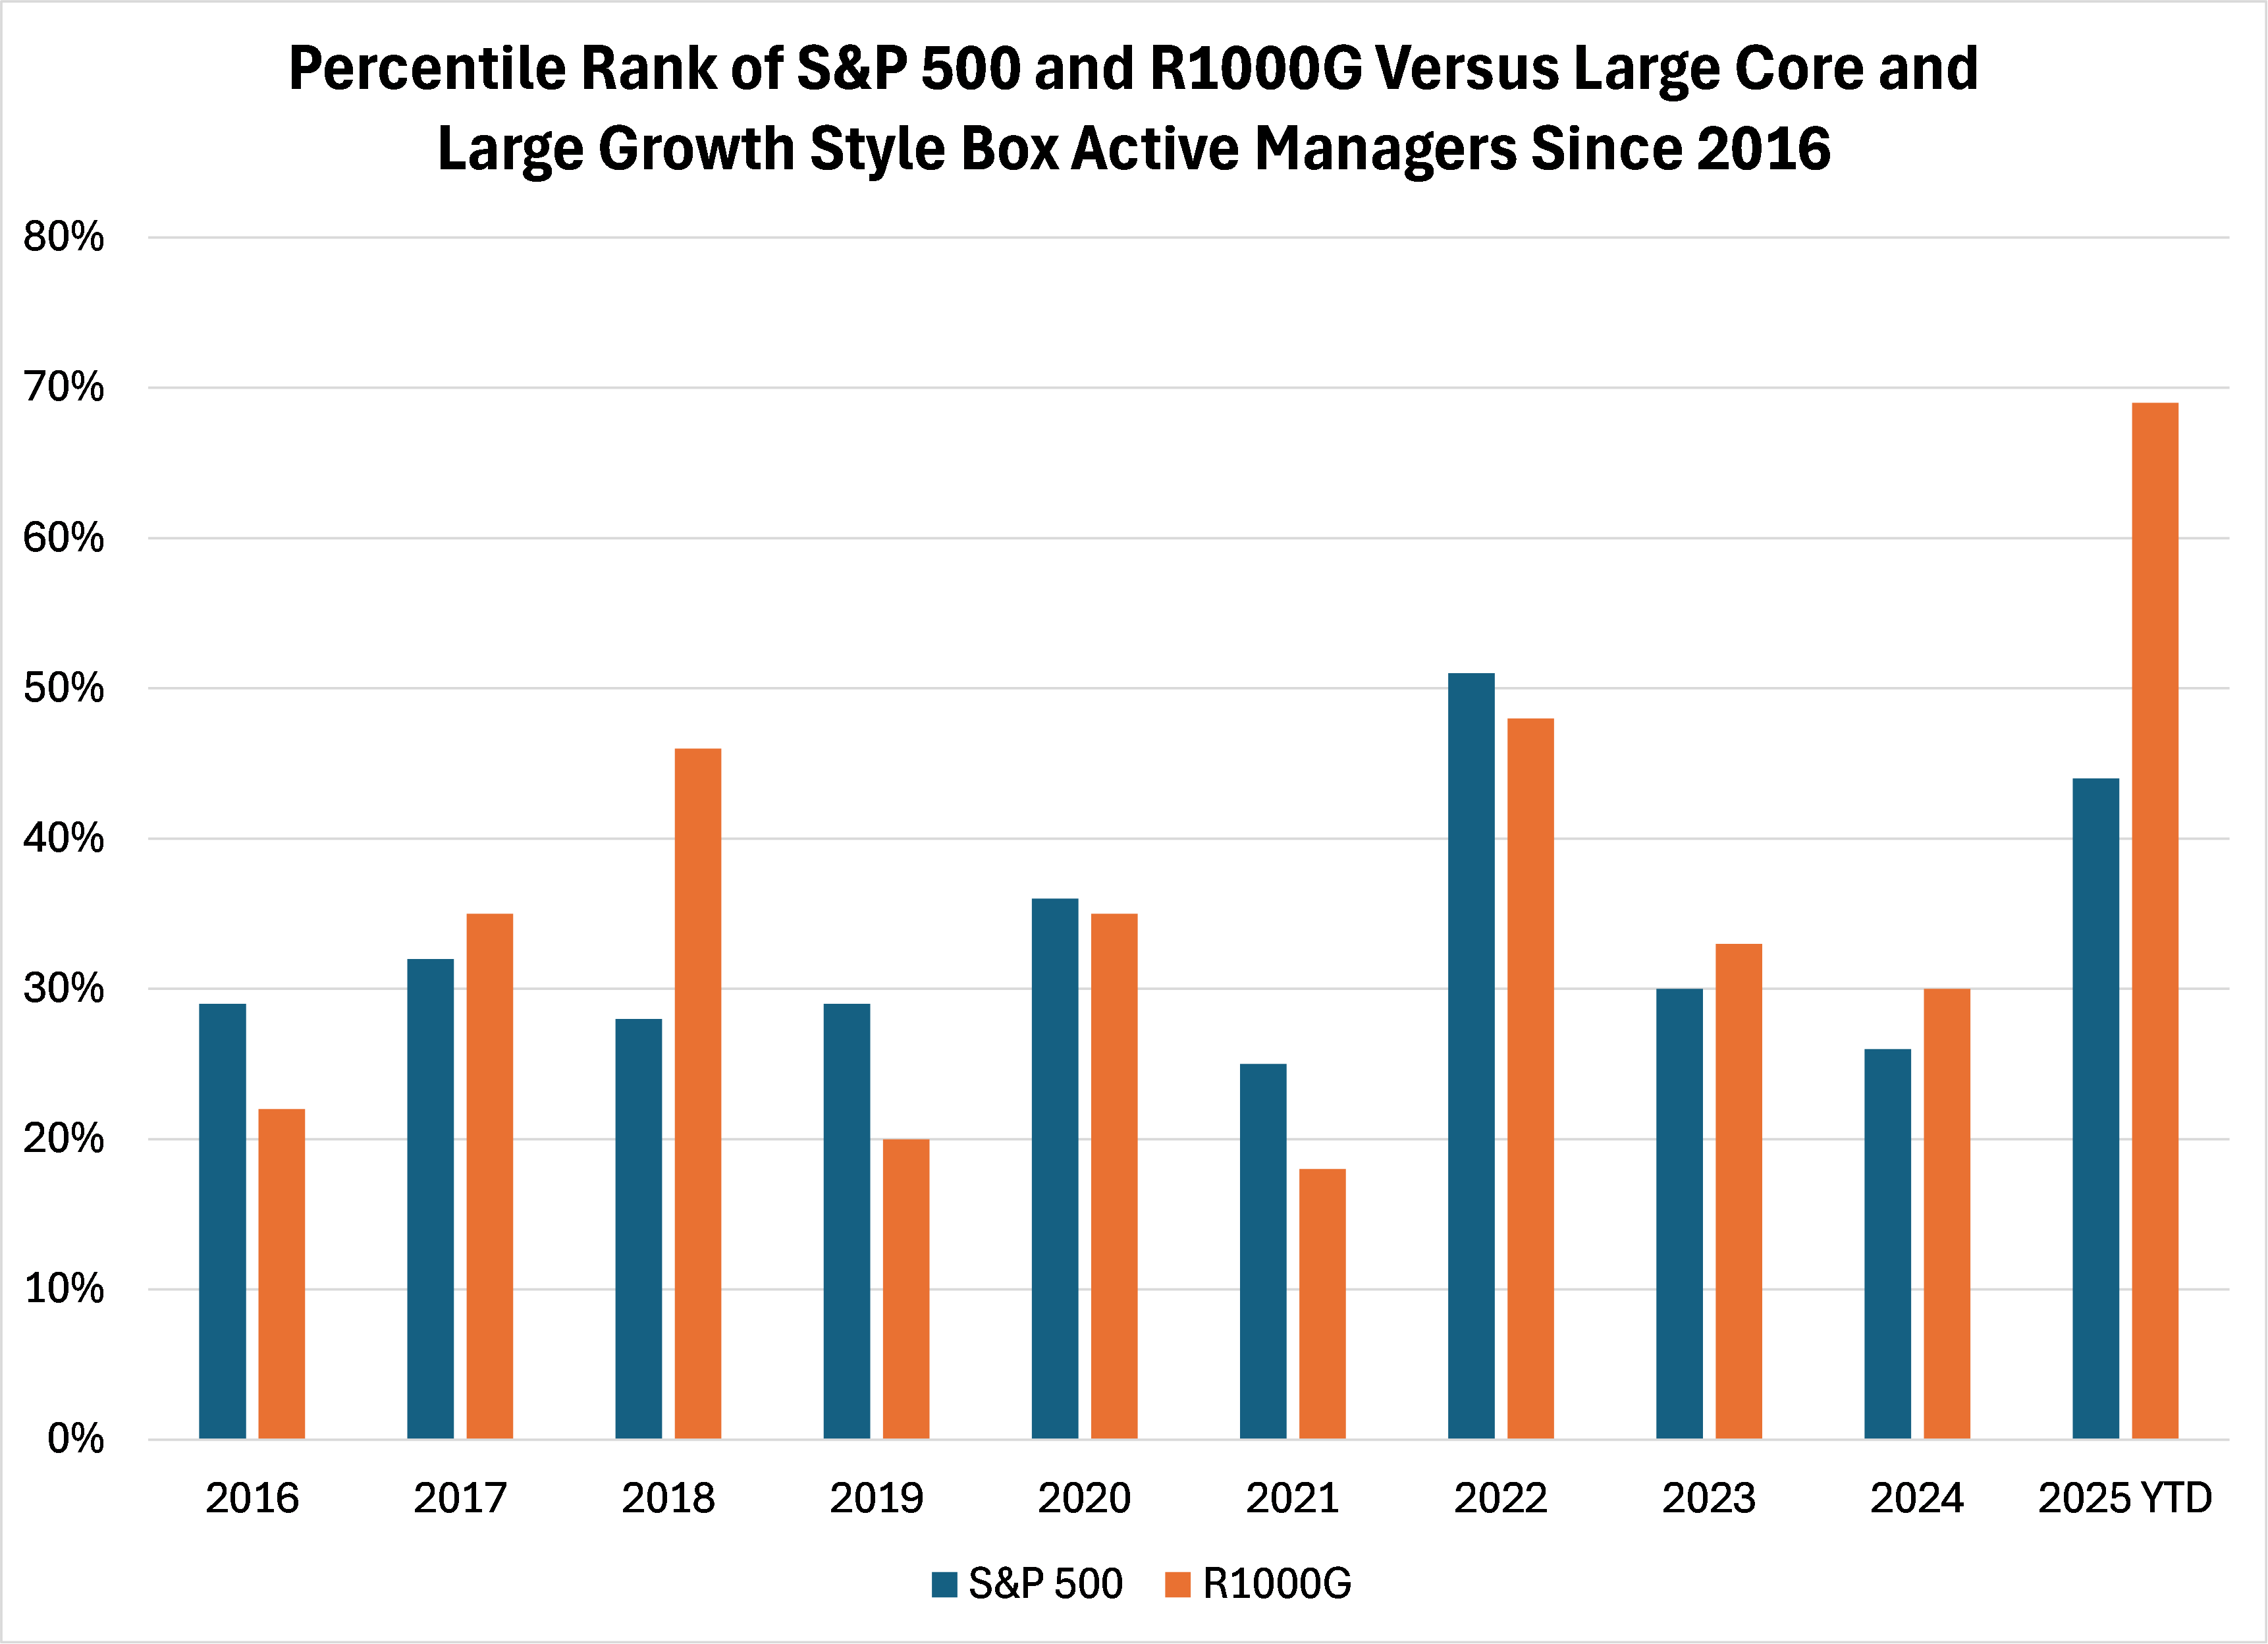
Note: Analysis uses “IWF” and “SPY” tickers for Russell 1000 Growth and S&P 500 performance and percentile ranking. The percentage is equivalent to the percentage of active managers beating their benchmark. Data as of May 16, 2025. Source: Morningstar.
A combination of factors has led to particularly sloppy conditions for many of the Magnificent Seven1 this year. As of May 16, only Microsoft (MSFT) and Meta Platforms (META) have outperformed the S&P 500 Index. The most menacing Thoroughbreds of recent years are being treated like also-rans driven by their geographic exposures as well as the outcome of, and concerns around, government anti-trust hearings.
It remains to be seen whether sloppy conditions continue to keep the broader market, along with the Magnificent Seven, stuck in the mud over the near and medium-term. Regardless, our portfolio managers will remain consistent in the application of their investment philosophies – with a focus on endurance and a healthy dose of humility for what cannot be predicted.
Earnings Takeaways
With hundreds of companies having now reported March-quarter results, there are a handful of common themes that are worth sharing directly through earnings call quotes. Overall, the high-end US consumer remains resilient while many companies believe they can effectively tackle the impact of tariffs through a combination of supply chain adjustments, cost reductions and price increases/surcharges. The primary question to these near-term conclusions is if cost reductions include layoffs, while price increases and surcharges eventually flow to the consumer, how much longer can the US economy remain resilient? Many companies and their customers are taking a “wait and see” approach, which is completely understandable. With retail-company earnings season quickly approaching the starting gate, we won’t need to wait too long for the next update.
March Quarter Earnings Season Themes
Theme #1: “Wait and See” Company/Customer Approach
Company | Ticker | Wait and See |
|---|---|---|
JP Morgan | JPM | We would characterize what we're hearing from our corporate clients as a little bit of a wait-and-see attitude. |
Wells Fargo | WFC | People are taking stock of what it means, figuring out where to sit and wait and where to continue to move forward. |
Morgan Stanley | MS | We don't yet know where trade policy will settle, nor what the actual transmission effects will be…given this, some clients are deferring activity. |
Fastenal | FAST | Customer tone did seem to shift…to plateauing as trade policy created some caution. |
Goldman Sachs | GS | My general message is to go slow and take a pause here until we have more clarity around a lot of these issues. |
M&T Bank | MTB | Our customers…are just really on pause right now. They don't know what the rules of the road are. |
Citigroup | C | We are seeing a pausing on significant Capex while everyone waits to get clarity on the full agenda. |
Packaging Corp | PKG | A lot of customers are looking at their business and everybody's being very prudent…I'm just going to use the word 'cautious'. |
Procter & Gamble | PG | So what we're seeing is a logical response from the consumer to pause, and that pause is reflected in retail traffic being down. |
Pool Corp | POOL | Macro uncertainty and persistently high interest rates are causing a wait and see pattern in demand for large discretionary purchases. |
Weyerhaeuser | WY | Prospective buyers turned more cautious in response to elevated uncertainty surrounding tariffs and the broader economy…continued in April. |
SLB | SLB | Commodity prices are challenged and until they stabilize, customers are likely to take a more cautious approach to near-term activity. |
Hilton | HLT | Weaker trends have continued…we believe travelers are largely in a wait and see mode as the rapidly changing macro continues to unfold. |
Sherwin-Williams | SHW | People are perhaps delaying a repair on their vehicle…the consumer is a little bit wait and see there. |
Snap | SNAP | At a high level, the macro is changing quickly and I think the path going forward isn't entirely clear. |
Floor & Décor | FND | Particularly the multifamily segment…this uncertainty is leading to a more cautious industry outlook around starting new projects and quotes. |
Theme #2: Travel and Entertainment Spend Weakness
Company | Ticker | T&E Spend Weakness |
|---|---|---|
Citigroup | C | The consumer…we've seen a shift towards essentials and away from travel and entertainment. |
United Airlines | UAL | Softer demand for travel…weakness magnified on off-peak flights…weakness in the main cabin. |
Southwest Airlines | LUV | It's the customers' discretionary travel that is really the crux of the slowdown. |
American Airlines | AAL | Our customers for whom travel is most discretionary…that's where the issue is. Domestic main cabin is weak…March and then into April. |
Alaska Air | ALK | We are currently evaluating certain off-peak capacity adjustments as we continue to monitor the demand environment. |
Domino's Pizza | DPZ | Delivery was down 1.5% in the quarter…our delivery business continues to be impacted by macro pressures. |
Airbnb | ABNB | We've absolutely seen a decline in popularity of foreign travelers coming to the US…Canadians are traveling at a much lower rate to the US. |
Hilton | HLT | Pressured demand particularly across leisure…softening demand patterns as the quarter progressed. |
Visa | V | We saw travel and entertainment growth decelerate. |
Marriott | MAR | We are lowering our guidance for full year RevPAR growth due to a more cautious outlook in our US and Canada region. |
American Express | AXP | In T&E, we saw a sequential slowdown in airline billings growth. |
Expedia | EXPE | US demand was soft…saw pressure on key inbound US corridors. Inbound bookings from Canada fell nearly 30%. |
Theme #3: High-End Consumer Still Spending
Company | Ticker | High End Consumer Still Resilient |
|---|---|---|
Wells Fargo | WFC | More affluent customers continue to show strength, while less affluent customers show more stress. |
United Airlines | UAL | So far, we've seen no deterioration in high-end consumers' willingness to purchase a premium experience. |
US Bancorp | USB | Our mix does tilt toward the more affluent customer…we are seeing steady consumer spend patterns. |
American Express | AXP | We continued to see solid growth across our affluent US consumer base with spend up 8%. |
Alaska Air | ALK | Just looking at our first-class cabin, it's sort of been unaffected by the macro right now. We are not seeing any pressure in the front cabin. |
Booking Holdings | BKNG | We saw some evidence of a bifurcated economy in the US…higher star rating hotels appear to be more resilient than lower star rating hotels. |
McDonald's | MCD | Traffic growth from the high-income cohort remains solid, illustrating the divided US economy. |
Airbnb | ABNB | We are seeing the higher-income traveler somewhat unimpacted by the current macro conditions…growth is very stable and very healthy. |
Uber | UBER | We're not seeing trade downs in terms of the kinds of restaurants that our customers are eating at. |
Marriott | MAR | The luxury tier had the strong occupancy growth…the strongest percentage ADR growth of any tier where we operate. |
Theme #4: Tariff Costs Are Seemingly Manageable
Company | Ticker | Tariffs - Manageable |
|---|---|---|
GE Aerospace | GE | We expect to reduce the tariff costs to roughly $500 million. We're taking additional actions to offset this remaining impact. |
Danaher | DHR | Based on what is currently implemented, we believe we can largely offset the impact of these tariffs. |
3M | MMM | We can partially offset the headwind for an estimated 2025 net EPS impact of $0.20-$0.40 (full year guidance is $7.60-$7.90). |
Kimberly-Clark | KMB | $300 million gross impact from the tariffs. We're rapidly moving to address at least a third this year. |
Pentair | PNR | We have taken several steps to mitigate tariffs across our portfolio…maintaining our initial sales and EPS guidance with current tariffs. |
Boeing | BA | The net annual impact of higher tariffs on our input costs is manageable and within our plan. |
Otis Worldwide | OTIS | We expect a negative impact of $45-$75 million to 2025 operating profit inclusive of our mitigation efforts. |
Avery Dennison | AVY | We expect the direct impacts of material purchases to be relatively low and largely mitigated. |
Procter & Gamble | PG | The tariff rates…about 3% of cost of goods sold, or a 140-180 bps margin impact. |
NXP Semiconductors | NXPI | The direct impact of the current tariffs is immaterial to our financials. |
Sherwin-Williams | SHW | With regards to tariffs…the vast majority of our raw materials are sourced in the region where we are manufacturing. |
AO Smith | AOS | We estimate the annual impact of tariffs could increase our total cost of goods sold by 6-8%...exclusive of mitigation efforts. |
Ecolab | ECL | We estimate the annual impact from tariffs to be a few hundred million dollars. |
Trane Technologies | TT | Net tariff costs are included in our EPS guidance for the year and are expected to have zero impact. |
Caterpillar | CAT | The tariffs…are currently estimated to be a cost headwind of about $250 - $350 million, net of our initial mitigation efforts. |
Garmin | GRMN | We estimate the gross impact from tariffs on our 2025 results prior to any mitigations…$100 million of increased cost. |
Church & Dwight | CHD | Tariffs…projected a gross 12-month run rate exposure of $190 million. The net impact…is expected to reduce our exposure by 80%. |
DuPont | DD | Estimated cost exposure in 2025 before mitigation action is about $500 million on an annualized basis. |
Eaton | ETN | We will fully compensate for the tariff impact through actions. |
Carrier | CARR | We are fully mitigating our tariff exposure. |
Int'l Flavors & Fragrances | IFF | On a gross basis we have a little more than $100 million of exposure |
Mattel | MAT | Taking mitigating actions designed to fully offset the potential cost impact of tariffs. |
Clorox | CLX | Our exposure to tariffs is relatively limited…unmitigated 12-month run rate of about $100 million. |
Theme #5: Price Increases/Surcharges to Help Offset Tariff Costs
Company | Ticker | Price/Surcharges to Help Offset Tariffs |
|---|---|---|
Danaher | DHR | Can largely offset through a combination of supply chain adjustments, surcharges, manufacturing footprint changes and other cost actions. |
Avery Dennison | AVY | With the tariffs…we'll look to implement some surcharges to manage part of that. |
Masco | MAS | Our pricing has been responsive to (tariffs). And we're going to continue to execute on that. |
Skechers | SKX | We're looking at three levers to deal with higher tariffs…resourcing, vendor cost sharing and pricing…all are being actively pursued. |
AO Smith | AOS | In North America in response to tariff cost increases, we have announced price increases of 6-9% on most of our water heater products. |
Ecolab | ECL | To mitigate the (tariff) impact, we recently announced a 5% rate surcharge for all customers in the US. |
Trane Technologies | TT | We will take surgical pricing actions to offset tariff impacts, dollar-for-dollar. |
Garmin | GRMN | We're evaluating pricing specifically in context of each market and product line. |
Illinois Tool Works | ITW | At a high level, the strategy is to offset tariffs with appropriate pricing. |
Floor & Décor | FND | It is likely that we'll need to raise prices to mitigate some of the incremental tariffs following our negotiations. |
Mohawk Industries | MHK | We've begun price increases and expect to compensate for the present tariff levels. |
Stanley Black & Decker | SWK | Price increases will be necessary in the US market due to the current tariffs. And we have implemented a substantial increase in April. |
DuPont | DD | We're pursuing supply chain adjustments, sourcing strategies, surcharges and pricing adjustments. |
Eaton | ETN | We will continue to take the necessary commercial actions to offset the impact of tariffs. |
Carrier | CARR | The balance of about $300 million via price which represents a little over 1% of additional pricing. |
Int'l Flavors & Fragrances | IFF | We are working with our customers on pricing surcharges to fully compensate. |
Mattel | MAT | We are taking a strategic approach to pricing across the portfolio and have a flexible framework that can adapt should tariffs change. |
Clorox | CLX | We're looking at targeted price increases that would be more modest in magnitude than what we've seen in the past few years. |
Note: Comments are from company March quarter earnings call transcripts.
Source: FactSet.
Thanks for reading, and remember to never skip a Beat – Eric
The views expressed are those of the author and Brown Advisory as of the date referenced and are subject to change at any time based on market or other conditions. These views are not intended to be and should not be relied upon as investment advice and are not intended to be a forecast of future events or a guarantee of future results. Past performance is not a guarantee of future performance and you may not get back the amount invested. The information provided in this material is not intended to be and should not be considered to be a recommendation or suggestion to engage in or refrain from a particular course of action or to make or hold a particular investment or pursue a particular investment strategy, including whether or not to buy, sell, or hold any of the securities mentioned. It should not be assumed that investments in such securities have been or will be profitable. To the extent specific securities are mentioned, they have been selected by the author on an objective basis to illustrate views expressed in the commentary and do not represent all of the securities purchased, sold or recommended for advisory clients. The information contained herein has been prepared from sources believed reliable but is not guaranteed by us as to its timeliness or accuracy, and is not a complete summary or statement of all available data. This piece is intended solely for our clients and prospective clients, is for informational purposes only, and is not individually tailored for or directed to any particular client or prospective client.
The S&P 500® Index represents the large-cap segment of the U.S. equity markets and consists of approximately 500 leading companies in leading industries of the U.S. economy. Criteria evaluated include market capitalization, financial viability, liquidity, public float, sector representation and corporate structure. An index constituent must also be considered a U.S. company. These trademarks have been licensed to S&P Dow Jones Indices LLC. S&P, Dow Jones Indices LLC, Dow Jones, S&P and their respective affiliates (collectively "S&P Dow Jones Indices") do not sponsor, endorse, sell, or promote any investment fund or other investment vehicle that is offered by third parties and that seeks to provide an investment return based on the performance of any index. This document does not constitute an offer of services in jurisdictions where S&P Dow Jones Indices does not have the necessary licenses. S&P Dow Jones Indices receives compensation in connection with licensing its indices to third parties.
Russell 1000® Growth Index measures the performance of the large-cap growth segment of the U.S. equity universe. It includes those Russell 1000® Index companies with higher price-to-book ratios and higher forecasted growth values. The Russell 1000® Growth Index is constructed to provide a comprehensive and unbiased barometer for the large-cap growth segment. The Index is completely reconstituted annually to ensure that new and growing equities are included and that the represented companies continue to reflect growth characteristics. Russell® and other service marks and trademarks related to the Russell indexes are trademarks of the London Stock Exchange Group Companies. An investor cannot invest directly into an index.
An investor cannot invest directly into an index.
Earnings per share (EPS) is calculated as a company's profit divided by the outstanding shares of its common stock.
1Magnificent Seven stocks: Alphabet (GOOG), Amazon (AMZN), Apple (AAPL), Meta (META), Microsoft (MSFT), NVIDIA (NVDA), and Tesla (TSLA).
Source: FactSet®. FactSet is a registered trademark of FactSet Research Systems, Inc