
Fast Reading
- Indices have evolved from simple market barometers to powerful benchmarks that materially shape investor behavior. Market‑cap‑weighted indices have become increasingly concentrated, with a small group of companies now driving most returns, raising risks, distorting comparisons, and weakening their usefulness as broad market proxies.
- Because leadership is so narrow, relying solely on indices can distort performance assessment, making diversification, fundamentals and risk management more meaningful guides. History shows highly concentrated periods often reverse, so investors increasingly pair benchmarks with absolute return, drawdown‑control and long‑term objective‑based measures.
Introduction
The evolution of indices began more than a century ago, when Charles Dow introduced his first stock average in 1884 as a simple barometer of economic health. His approach shifted attention from individual companies to a composite view of market conditions. This concept evolved again in 1896 with the creation of the Dow Jones Industrial Average, signaling an important step in understanding markets through aggregated measures.1
As markets expanded, 1957 saw the launch of the S&P 500® Index transitioning to a market capitalization–weighted structure to better represent the broad U.S. stock market.2 Across the pond, the FTSE 100 Index debuted in 1984, becoming Britain’s premier large-cap index and providing real-time insight into U.K. market dynamics, replacing the narrower FT30.3 In the late 1960s, Morgan Stanley Capital International developed the MSCI EAFE Index to track equity performance across developed markets outside North America, and by 1986 it had solidified its role as a global benchmark for international investors.4 Together, these indices illustrate the shift from simple, price-based averages to global, market-cap weighted frameworks.
Today, indices have become deeply embedded in how we interpret markets. Beyond measuring prices, they increasingly shape narratives around success, risk, and leadership. Indices are widely used as benchmarks against which strategies, managers, and asset classes are judged. Yet this widespread reliance raises a key question: Are indices still impartial guides?
This piece explores how index construction has evolved, how passive investing has amplified concentration, and why these changes matter for investors. To understand the implications for performance evaluation, it is essential to revisit how indices are created, how they came to be used as benchmarks, and whether they still provide a fair reflection of the opportunity set available to investors.
Index vs. Benchmark: What’s The Difference And Why It Matters
In simple terms, a benchmark is a standard used to judge whether an investment portfolio met its objective and used its opportunity set well. It can be an index, an absolute target (e.g., inflation +4%), or a custom blend aligned to liabilities.
An index measures a defined slice of the market under explicit rules—including universe, weighting, eligibility, and review schedule. Different index providers take distinct approaches to constructing and maintaining their indices, and these methodological choices play a meaningful role in how each Index behaves. The S&P 500 Index, for example, is curated by a committee (made up of professional members of S&P Dow Jones Indices’ staff) that evaluates factors such as profitability, liquidity, sector representation, and the company’s relevance to the U.S. economy, creating an index that is deliberately selective and relatively stable over time.5 By contrast, the Russell indices follow a fully rules‑based approach: Once a year, companies are ranked by market capitalization and reassigned automatically, leading to a major annual reconstitution that often drives significant market flows.6 MSCI uses a global, rules‑driven framework that emphasizes liquidity, free‑float adjustability, and investability, with quarterly reviews to ensure its indices remain aligned with evolving market dynamics.7 The FTSE 100 Index applies similarly transparent rules, adding or removing companies based on market‑cap thresholds at quarterly intervals.8 These differences (committee judgement versus automated selection, the frequency of rebalancing, and the specific eligibility criteria) shape an index’s turnover, concentration, and responsiveness. As a result, indices that appear similar on the surface can deliver materially different exposures, which is why understanding how they are built is essential when using them as benchmarks for evaluating performance.
Active vs Passive: What Flows Really Do
Passive, market‑cap‑weighted index funds were created to deliver low‑cost, diversified market access. That premise still holds, but today's market structure has pushed these strategies toward increasing concentration instead of the diversification for which they were originally designed. As market leadership narrows, marginal dollars in passive vehicles are automatically directed to the largest companies, raising their weights further and reinforcing the leadership loop. The mechanism is simple: as prices rise, index funds must add exposure to maintain cap‑weights; when prices fall, those same funds must reduce exposure. This autocorrelation of flows with price can magnify both advances and drawdowns when a small cohort dominates benchmark returns.
The scale and speed of this shift are notable. A handful of technology platform and semiconductor leaders now account for an outsized share of index level outcomes, driven by technological leadership and the race to commercialize artificial intelligence. These are exceptional businesses, but their size means market performance increasingly embeds a narrow set of assumptions — about technology adoption curves, regulation, capital costs, and long term growth — that may or may not be realized. This concentration is becoming increasingly relevant: By early 2025, the top 10 companies in the S&P 500 Index represented nearly 40% of its market capitalization, compared with roughly 20–28% from 1990 to 2010.9 Investors tracking the Index today are therefore placing a significant share of their portfolio in a small group of companies — primarily Apple (AAPL), Microsoft (MSFT), NVIDIA (NVDA), Amazon (AMZN), Alphabet (GOOG), Meta (META), and Tesla (TSLA). Periods of strong performance can mask the risks inherent in such narrow leadership; if these companies stumble, that vulnerability is very quickly exposed.
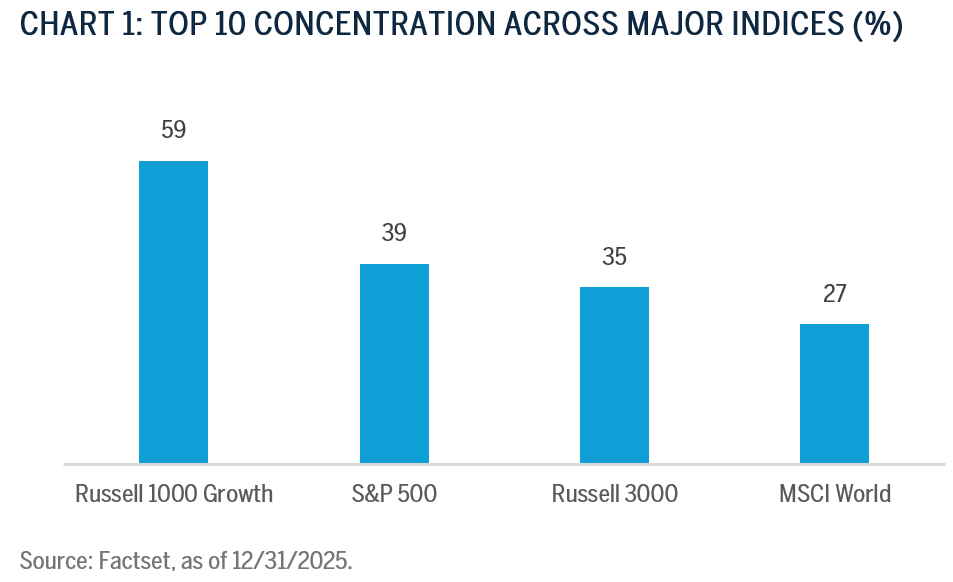
Top 10 Weighting across Major Indices:
- Russell 1000® Growth Index: Top 10 constituents represent 59% of the index by weight and contributed 73% for the calendar year 2025.10
- Russell 3000® Index: Roughly 35% concentrated in 10 stocks.11
- MSCI World Index: Top 10 names make up about 27%, so a handful of U.S. companies drive much of “global” equity performance.12
Being among the top 10 today reflects current market leadership, but it is not a guarantee of durability. This perspective underpins our firm’s emphasis on diversification and business quality rather than anchoring portfolios to whichever companies happen to be most heavily weighted at a point in time.
Disversification: Why Does It Matter?
Chart 2 highlights a striking reality: The S&P 500 Index is more concentrated today than at any point in the past 40 years; we believe this makes it a far less accurate reflection of the broader market. This pattern isn’t confined to the U.S. Similar dynamics are evident in Germany, France, and China.
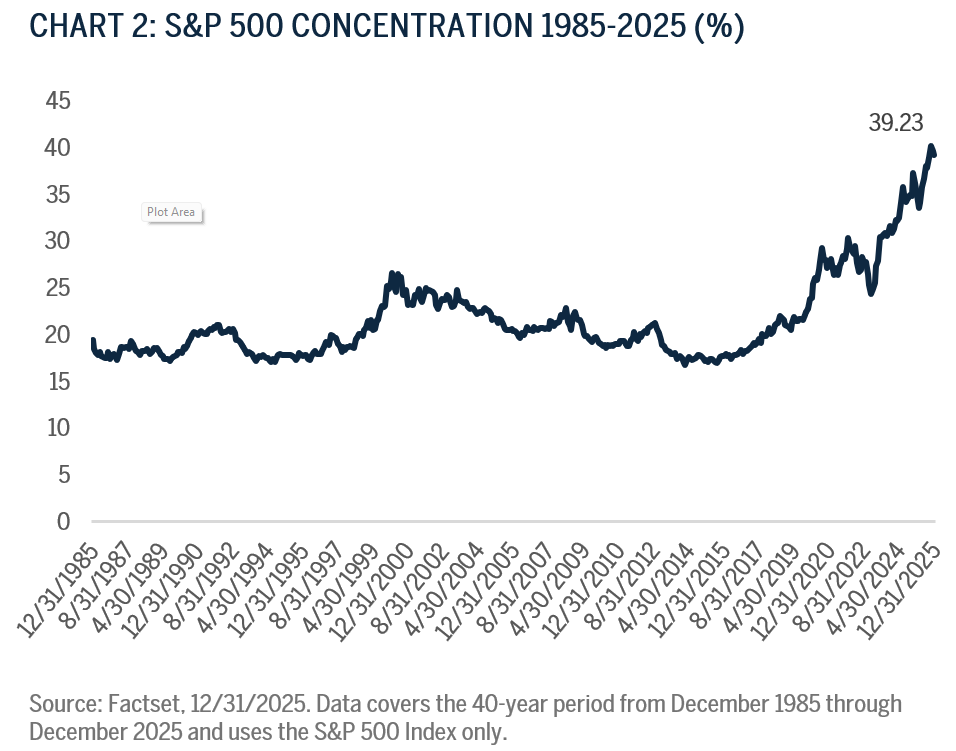
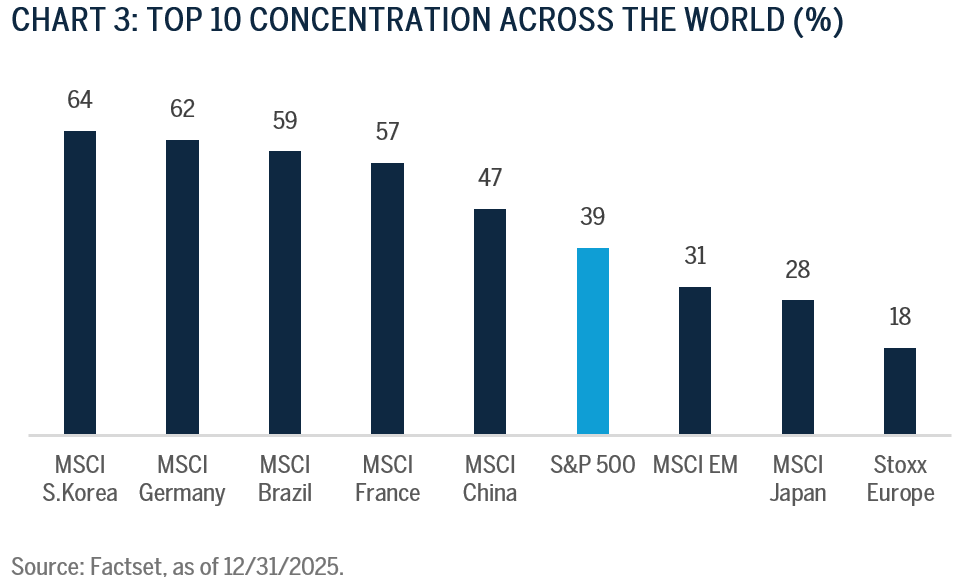
Chart 3 shows that at the end of 2025, the U.S. market’s top 10 concentration stood at roughly 39% of total market capitalization. While elevated, this remains lower than in several other major markets. By comparison, Germany, France, and China, to name a few, saw their top 10 names account for 62%, 57%, and 47% respectively.13 We believe this underscores that rising concentration is a global trend, not just a U.S. dynamic.
While the U.S. market is far larger in absolute terms, over $60 trillion in equity market capitalization compared to roughly $12 trillion for China, $2 trillion for Germany, and $3 trillion for France, the concentration risk remains significant.14 This is because scale matters.
The U.S. alone accounts for roughly 40-45% of global equity markets, so the absolute size of its largest constituents has a profound impact not only locally, but also globally, as highlighted by Goldman Sachs’ research on rising U.S. equity market hegemony.15 In contrast, while concentration in smaller markets like Germany or France can be even more pronounced due to their limited number of large firms, their smaller scale means their global impact is less systemic.
As in baseball, success usually comes from the whole lineup working together. But in today’s market, it’s as if a couple of star sluggers are driving more than half the team’s runs. If even one of them gets hurt or stops hitting, the team’s chances quickly worsen. When a few players carry the weight of the entire roster, the whole game depends on their performance.
Such concentration amplifies volatility, embeds sector bias, and makes relative comparisons less meaningful. It is helpful to look at past periods of extreme concentration to see why. The Nifty Fifty era in the 1960s and the Internet stock run-up of the late 1990s were followed by extended phases where market leadership changed and returns normalized. These examples serve as a reminder that relying on a narrow set of companies can distort risk and return expectations. It prompts a simple question: How much weight should any single measure carry?
The Bigger Picture
Dow created indices as a convenient way to track market performance: They capture price movements rather than underlying drivers such as productivity, employment, or innovation — factors that sustain long-term growth. Over time, this distinction has become more pronounced.
Recent years have seen equity indices rise sharply even as broader economic measures, such as GDP growth and wage trends, remain more subdued.16 Equity markets can deliver strong returns even when GDP growth is modest, and vice versa. For example, Ireland posted GDP growth above 5% from 1998 to 2020 but delivered barely 1% in total equity returns, while several emerging markets achieved double-digit returns despite slower economic expansion. Using benchmarks as a proxy for economic vitality can therefore oversimplify reality. This disconnect is further magnified by growing concentration within major indices, where performance increasingly reflects a handful of mega-cap stocks rather than the broader economy.
Broadening The Definition Of Success
Increasingly, investors are complementing benchmark comparisons with measures that align more closely to long-term objectives, such as absolute returns, capital preservation, and risk-adjusted outcomes. These approaches prioritize what matters most, such as protecting wealth, meeting strategic goals, and navigating uncertainty, rather than chasing short-term relative rankings. For institutions such as pension funds, success is often measured by meeting liabilities rather than outperforming an index, making asset/liability matching critical. Strategies that limit drawdowns often compound wealth more effectively over time, even if they occasionally lag during speculative rallies, because they avoid the need to recover from deep losses.17
So, as indices become more concentrated and volatile, relying solely on them to benchmark performance may not always capture progress toward investor objectives. Many institutions continue to use indices and their associated benchmarks as a key reference point, while also incorporating complementary perspectives, such as peer group comparisons and outcome-based metrics, to provide a fuller picture. These additional measures help frame success in terms of resilience and consistency, alongside traditional relative rankings.
Our Beliefs
We believe success is measured by resilience and consistency. Over the past decade, our diversified strategies U.S. Large-Cap Sustainable Growth and Global Leaders have compounded 10‑year net annualized returns of 15.1% and 12.3% respectively, proving the strength of this approach.18 While recent markets have rewarded concentration, we remain comfortable with our positioning. Absolute returns are solid, and we believe diversification offers better protection against risk over the next five years. Our focus is on fundamentals, quality businesses, and long-term compounding.
Equally important is our focus on limiting downside risk. The math is clear: Avoiding deep losses matters more for long-term compounding than capturing every short-term rally. A portfolio that falls 33% must gain 50% just to break even; recovering from large drawdowns consumes time and erodes wealth. By prioritizing risk management and resilience, we aim to protect capital so that gains can compound effectively over time.19
Indices-aligned benchmarks remain important, and we continue to measure performance against them. At the same time, our investment decisions are guided by fundamentals and client objectives, as this approach reflects our commitment to building portfolios that balance opportunity with risk and deliver sustainable returns over the long term.
Conclusion
Our thinking reflects the evolution of markets themselves, adapting to new realities, but is not immune to their own limitations. In today’s environment, where index performance can be driven by a small number of companies, investors benefit from a broader perspective; one that considers long-term objectives, risk management, and consistency alongside relative rankings. Our approach emphasizes process; this discipline has supported strong outcomes over time and is designed to navigate uncertainty effectively. As markets evolve, so should the way we define achievement, moving beyond narrow comparisons to include measures that reflect resilience, compounding, and alignment with client goals.
- Pierce, P. S., ed. The Dow Jones Averages: 1885–1995. Foreword by J. A. Prestbo. Homewood, IL: Dow Jones‑Irwin, 1995.
- S&P Dow Jones Indices. “S&P 500®.” https://www.spglobal.com/spdji/en/indices/equity/sp-500/#overview
- FTSE Russell. “FTSE 100 Index Factsheet.” https://research.ftserussell.com/Analytics/FactSheets/Home/DownloadSingleIssue?issueName=UKX&isManual=False
- MSCI. “MSCI EAFE Index Factsheet.” https://www.msci.com/documents/10199/822e3d18-16fb-4d23-9295-11bc9e07b8ba
- S&P Dow Jones Indices. “S&P U.S. Indices Methodology.” https://www.spglobal.com/spdji/en/documents/methodologies/methodology-sp-us-indices.pdf
- FTSE Russell. “Russell US Equity Indexes.” https://www.lseg.com/content/dam/ftse-russell/en_us/documents/ground-rules/russell-us-indexes-construction-and-methodology.pdf
- MSCI. “MSCI Index Calculation Methodology.” https://www.msci.com/indexes/documents/methodology/0_MSCI_Index_Calculation_Methodology_20250826.pdf
- FTSE Russell. “Guide to Calculation Methods for the FTSE UK Index Series.” https://www.lseg.com/content/dam/ftse-russell/en_us/documents/ground-rules/ftse-uk-index-series-guide-to-calc.pdf
- FactSet®, as of 12/31/2025
- FactSet®, as of 12/31/2025
- FactSet®, as of 12/31/2025
- FactSet®, as of 12/31/2025
- FactSet®, as of 12/31/2025
- World Bank. Market Capitalization of Listed Domestic Companies (Current US$) – United States, France, Switzerland. World Federation of Exchanges (WFE) database, 2024. https://data.worldbank.org/indicator/CM.MKT.LCAP.CD?locations=US
- Goldman Sachs Global Strategy Paper. The Concentration Conundrum: What to Do About Market Dominance. https://www.gspublishing.com/content/research/en/reports/2024/03/11/407ceab1-902a-431e-9e6c-f374eafad2aa.pdf
- MSCI Research. “Does Positive GDP Growth Lead to Strong Stock Returns?” https://www.msci.com/research-and-insights/quick-take/does-positive-gdp-growth-lead-to-strong-stock-returns
- Brown Advisory. Irrational Behaviour, Rational Investing: How We Overcome Our Biases. https://www.brownadvisory.com/intl/insights/irrational-behaviour-rational-investing-how-we-overcome-our-biases
- FactSet® as of 12/31/2025
- Brown Advisory. Irrational Behaviour, Rational Investing: How We Overcome Our Biases. https://www.brownadvisory.com/intl/insights/irrational-behaviour-rational-investing-how-we-overcome-our-biases
Disclosures
Click here to access the Brown Advisory Large-Cap Sustainable Growth and Global Leaders Composites.
The views expressed are those of the author and Brown Advisory as of the date referenced and are subject to change at any time based on market or other conditions. These views are not intended to be and should not be relied upon as investment advice and are not intended to be a forecast of future events or a guarantee of future results.
Past performance is not a guarantee of future performance, and you may not get back the amount invested.
The information provided in this material is not intended to be and should not be considered to be a recommendation or suggestion to engage in or refrain from a particular course of action or to make or hold a particular investment or pursue a particular investment strategy, including whether or not to buy, sell or hold any of the securities or funds mentioned. It should not be assumed that investments in such securities have been or will be profitable. To the extent that specific securities are mentioned, they have been selected by the author on an objective basis to illustrate views expressed in the commentary and do not represent all of the securities purchased, sold or recommended for advisory clients. This material is intended solely for our clients and prospective clients, is for informational purposes only and is not individually tailored for or directed to any particular client or prospective client.
Sustainable investment considerations are one of multiple informational inputs into the investment process, alongside data on traditional financial factors, and so are not the sole driver of decision-making. Sustainable investment analysis may not be performed for every holding in the strategy. Sustainable investment considerations that are material will vary by investment style, sector/industry, market trends and client objectives. The strategy seeks to identify companies that it believes may be desirable based on our analysis of sustainable investment related risks and opportunities, but investors may differ in their views. As a result, the strategy may invest in companies that do not reflect the beliefs and values of any particular investor. The strategy may also invest in companies that would otherwise be excluded from other funds that focus on sustainable investment risks. Security selection will be impacted by the combined focus on sustainable investment research assessments and fundamental research assessments including the return forecasts. The strategy incorporates data from third parties in its research process but does not make investment decisions based on third-party data alone.
The information contained herein has been prepared from sources believed to be reliable but is not guaranteed by us as to its timeliness or accuracy and is not a complete summary or statement of all available data. The information in this document has not been independently reviewed or audited by outside certified public accountants. The information provided is not intended to be a forecast of future events or a guarantee of future results. Past performance is not indicative of future performance.
Terms and Definitions:
Market Capitalization refers to the aggregate value of a company’s publicly-traded stock. Statistics are calculated as follows: Weighted Average: the average of each holding’s market cap, weighted by its relative position size in the portfolio; Weighted Median: the value at which half the portfolio's market capitalization weight falls above and half falls below; Maximum and Minimum: the market caps of the largest and smallest companies, respectively, in the portfolio.
The S&P 500® Index is a capitalization‑weighted index of 500 stocks designed to measure performance of the broad U.S. economy. Index returns assume reinvestment of dividends and do not reflect fees or expenses. An investor cannot invest directly into an index. Standard & Poor’s, S&P®, and S&P 500® are registered trademarks of Standard & Poor’s Financial Services LLC, a subsidiary of S&P Global Inc.
The Dow Jones Industrial Average® (DJIA) is a price‑weighted measure of 30 U.S. blue‑chip companies, representing major U.S. industries except transportation and utilities.
The MSCI EAFE Index captures large and mid‑cap representation across Developed Markets excluding the U.S. and Canada and covers approximately 85% of free‑float‑adjusted market capitalization in each country.
The MSCI World Index captures large and mid‑cap representation across Developed Markets, covering approximately 85% of free‑float‑adjusted market capitalization in each country.
The MSCI Korea Index measures the performance of large and mid‑cap segments of the South Korean market, covering about 85% of the equity universe.
The MSCI Germany Index measures performance of the large and mid‑cap segments of the German market, covering about 85% of the equity universe.
The MSCI Brazil Index measures performance of large and mid‑cap segments of the Brazilian market and covers about 85% of the equity universe.
The MSCI France Index measures performance of large and mid‑cap segments of the French market and covers about 85% of the equity universe.
The MSCI China Index captures large and mid‑cap representation across China A, B, and H shares, Red chips, P chips, and ADRs, covering ~85% of the free‑float‑adjusted market cap.
The MSCI Emerging Markets Index captures large and mid‑cap representation across Emerging Markets countries, covering approximately 85% of the free‑float‑adjusted market cap.
MSCI® is a trademark of MSCI Inc. All MSCI indexes and products are trademarks and service marks of MSCI or its subsidiaries.
The FT30 (FT Ordinary Index) is a U.K. equity index published by the Financial Times. It has largely been superseded by the FTSE 100 and should not be used for valuation or investment purposes.
The FTSE 100 Index is a market‑cap‑weighted index of the 100 largest U.K.‑listed blue‑chip companies that meet size and liquidity screens.
The Russell 1000® Growth Index measures performance of the large‑cap growth segment of the U.S. equity universe, including companies with higher forecast growth and higher price‑to‑book ratios.
The Russell 3000® Index measures performance of the largest 3,000 U.S. companies, representing ~98% of the investable U.S. equity market.
Frank Russell Company (“Russell”) owns the trademarks, service marks and copyrights related to the Russell Indexes. Russell® is a trademark of Frank Russell Company. Neither Russell nor its licensors accept liability for errors in the Russell Indexes or underlying data. No further distribution of Russell data is permitted without Russell’s written consent. “FTSE®”, “Russell®”, “FTSE Russell®” and related marks are trademarks owned or licensed by LSEG or its licensors.
The STOXX® Europe 600 Index is a broad measure of the European equity market, representing nearly 90% of the investable market across 17 countries and 11 industries. STOXX® is a trademark of STOXX Ltd.