
Fast Reading
- Credit spreads are near or at historic lows, limiting upside for excess returns and increasing downside risk, especially in investment-grade markets.
- Private credit has ballooned, absorbing risk from public markets amid looser regulation and weaker fundamentals, raising concerns about defaults and transparency.
- Current yield levels may tempt investors, but slower growth or sticky inflation could erode fundamentals and challenge the carry trade thesis.
Over the years, we have found that the work we do to identify inflection points carries the most power to filter signal from noise when conducting our investment process and articulating investment conviction and portfolio construction. There are many potential inflection points on our minds that are occurring in longer-form economics today, such as a globalised economy becoming more fragmented via trade policy and politics that affect supply chains; a return of the credit cycle (‘The Old Normal’); artificial intelligence (AI) and its impact on capital allocation, the economy and the workforce; peak levels of ‘labour hoarding’ within labour markets; fiscal and monetary policies within developed-market economies driving a ‘debasement’ trade within currencies, commodities such as gold and silver and steeper sovereign rate curves; goods-to-services transitions in consumer spending patterns; wealth disparity and its effect on increasingly polarised politics and a K-shaped economy; demographics of an aging population; the societal effects of social media; rising temperatures in both geopolitics and the Earth’s climate. Perhaps with a hint of foreshadowing, each of these topics either has been worthy or is worthy of its own space within a piece like this. But for now, we focus on a topic that we believe could be facing some shorter-term inflection points that have important investment considerations: credit valuation.
A lot of ink has been spilled on the topic of late-cycle behaviour patterns, such as relatively tight lending standards and lower levels of loan demand, valuation within credit and equity markets, circular and concentrated AI investment patterns, meme stocks, cryptocurrencies and retail investment bids. Other important inflection points related to valuation include the transition of public-to-private funding, credit default trends and composition, the reach for yield from credit investors and the absolute value of credit. In addition, we believe that there are important inflection points within corporate earnings power and debt-funded AI infrastructure investment; however, we will delve into those in a separate ‘Mind the Inflection Points’ article coming shortly.
Macroeconomic Interlude
As fixed income investors, and perhaps differently from some of our equity investor counterparts, we believe both macroeconomics and microeconomics must be considered during the investment process. The largest drivers of performance attribution within fixed income portfolios typically come from factors such as duration and curve positioning. The former is a measure of portfolio return sensitivity to changes in interest rates and the latter represents portfolio return sensitivity to changes in the shape of interest rate curves – generally macroeconomic discussions and investment theses. The remaining performance attribution drivers are primarily asset allocation and security selection. The former generally fits neatly between the microeconomic and macroeconomic discussions, representing position sizing and allocation to asset class and sector. The latter is typically a microeconomic factor and incorporates investment topics representing our research at the issuer and capital structure levels. The essence of these performance drivers has shaped our long-held view of the importance of having an investment process that incorporates a top-down and bottom-up fundamental approach to investing. We believe that the intersection of the top-down and bottom-up elements of our investment process, and the additional information we receive from sustainability research, which frames both risks and opportunities, provide a differentiated approach to generating risk-adjusted returns on behalf of our investors.
Credit Valuation
Now that the ‘income’ in fixed income has returned with developed market interest rates normalising after the zero-bound days of low inflation and quantitative easing, investors are increasingly becoming buyers of yield. In addition, spreads (i.e., credit risk premium over risk-free rates) within global corporate credit markets have collapsed as the reach for yield has intensified, creating somewhat of a technical buying pattern within the market. If we take a historical look at excess returns (return of a corporate bond over that of a risk-free rate of return) within global corporate credit markets, and make an adjustment to exclude the COVID era, we see a compelling and logical argument that excess returns oftentimes depend on the entry point. Today, spreads are at or near levels that reflect generational lows with global investment grade and high yield spreads trading around 80 and 300 basis points, respectively. This entry point puts an investor on the far left-hand side of charts 1 and 2 below, suggesting limited opportunity for excess returns going forward.
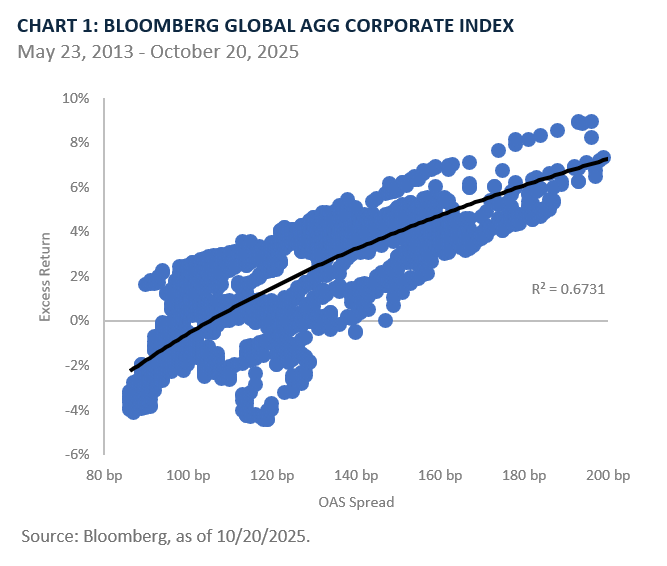
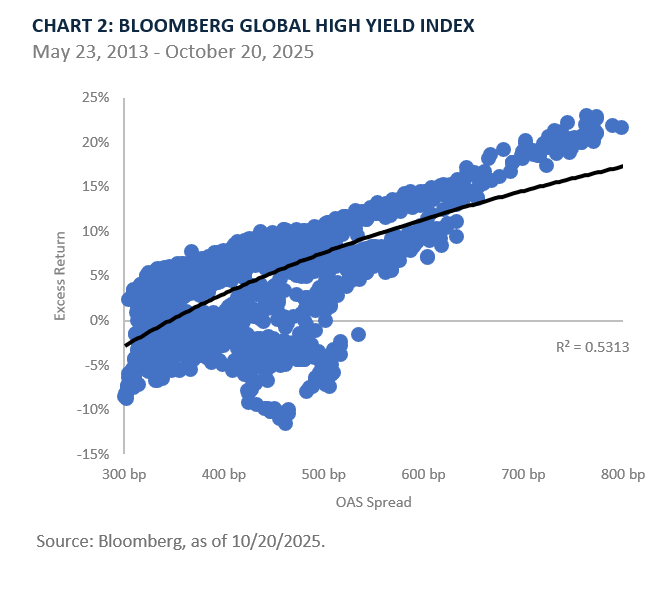
In fact, the charts suggest that 12-month-forward excess returns at current spread levels are more likely to be negative. We also believe that there are trends within the global corporate credit indices that must be considered in the context of spreads. The credit quality of the global investment-grade market has steadily deteriorated over the last 25 years for non-financial companies as BBB-rated companies currently represent more than 50% of the issuance versus approximately 30% in 2000.¹ To us, this suggests that normalised spread levels for the global investment-grade market should be higher, on a normalised basis, compared to long-term, historical averages. Alternatively, duration within the global high-yield market has decreased over the last three years, as issuers are likely limiting longer-term financing in a higher interest rate environment at the expense of capital market funding, from an average of four to three years. Hence, adjusting the long-term historical average spread noted above for duration would indicate an average of approximately 400 basis points. Credit quality within the global high-yield market has also been improving over time, suggesting lower average credit risk premiums. Our interpretation of these trends would be more relative downside skew in global investment-grade valuation, less relative downside skew in global high-yield valuation and more credit risk in private credit markets.
SCENARIO ANALYSES ON EXCESS AND TOTAL RETURN FOR BOND GEEKS
If you were to assume an entry point at current spreads of 80 and 300 basis points for global investment-grade and high-yield, duration of 6 and 3 years and interest rates at today’s equivalent durations of approximately 4.0% and 3.5%, it would take an estimated move higher in spreads of 13 and 100 basis points, respectively, to wipe out excess returns. Additionally, it would take an estimated move higher in spreads of 80 and 215 basis points, respectively, to wipe out 12-month-forward total returns. A move like the latter would effectively equate to spreads of 160 and 515 basis points, for global investment-grade and high-yield, compared to long-term average spreads (quarterly, over the last 25 years) of 140 and 529 basis points, respectively (charts 3 and 4, above). Furthermore, if we make aggregate assumptions within a default model context for the global high-yield market of 300 basis points of excess spread (long-term average credit risk premium), bond price of $0.98, default recovery of 40% and a default rate of 3%, the implied spread approximates 475 basis points – nearing the spread for global high-yield that wipes out 12-month-forward total return from current levels and notably lower than the long-term average spread highlighted above.
We believe trends within private credit markets are also important to consider as part of the credit valuation conversation. According to the Bank for International Settlements (BIS), private credit funds grew from approximately $0.2B in 2014 to $2.5T by the end of 2024, with corporate loans growing from $0.1B in 2010 to $1.2T by the end of 2024. We believe this growth, coupled with a stricter regulatory landscape for banks, has enabled a large transfer of risk from the global high-yield market noted above and bank balance sheets to the private credit market. We have also observed captive insurance company models that potentially transfer risk to policyholders and retail market access providing an incremental bid for private credit assets. We believe the economic incentives associated with the fees to put this capital to work, a loose regulatory environment that enables a lack of transparency and aggressive underwriting and mark-to-market practices, create a dangerous environment for credit investors. For example, we have observed we’re seeing some cracks in the market with recent defaults such as Tricolor and First Brands, increasing payment-in-kind interest volumes, and observed weakness in recent Business Development Company (BDC) equity performance.
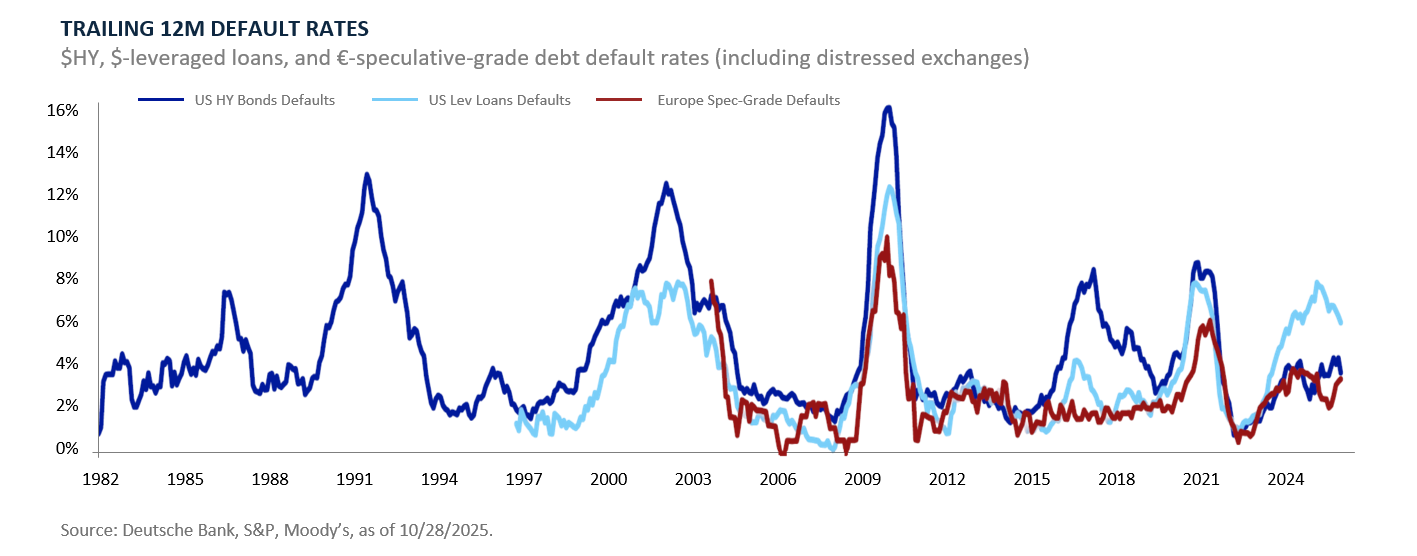
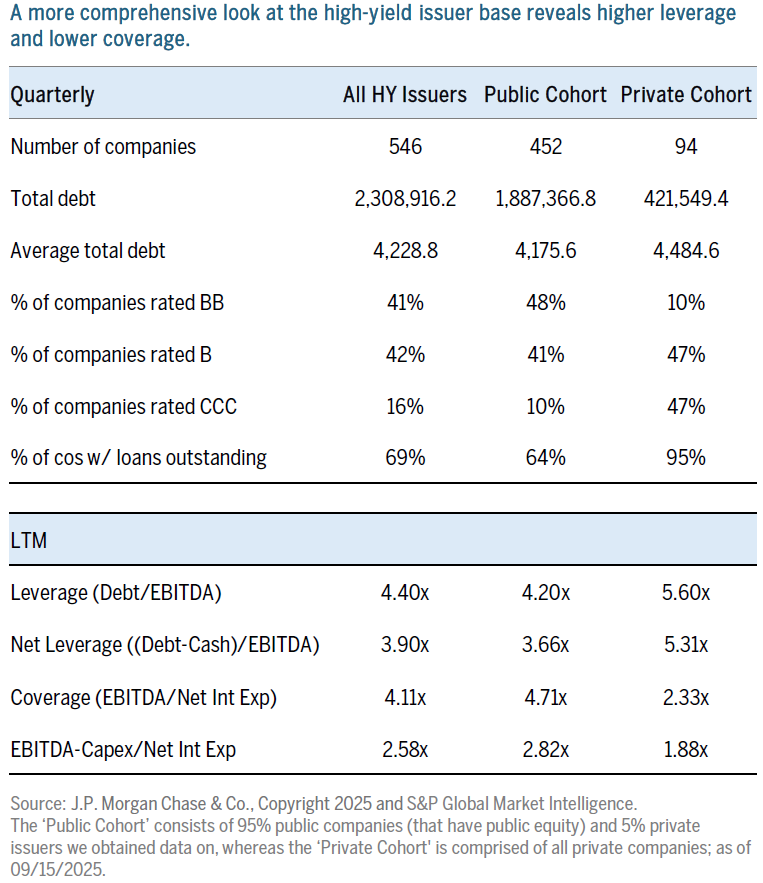
Deutsche Bank and J.P. Morgan have recently conducted comprehensive studies of the U.S. high-yield market, comparing public versus private companies and issuers of bonds versus loans that we think provide relevant proxies for credit risk within the private credit market. We note in the ‘Trailing 12M default rates’ chart that leveraged loan default rates have increased significantly compared to those of the high-yield market – different from past credit cycles. The table (below) with high-level credit metrics for the U.S. high-yield market shows that credit fundamentals across public and private cohorts have demonstrated materially different levels of risk, with the private cohort having significantly higher leverage and lower coverage metrics and credit quality.
In environments such as these, we inevitably find ourselves enmeshed in the debate surrounding carry within credit risks. The opportunity for carry, at these levels, could be seen as attractive given higher absolute yields and the assumption that spreads remain relatively unchanged from here. These are the assumptions that we think investors in credit are implicitly making today, particularly those that are reaching for yield.
We are concerned that slower growth and its likely influence on lower inflation levels could have two negative implications: first, it could pressure credit fundamentals and lead to wider spreads; second, it could lead to lower interest rates on the front end and belly of interest rate curves that bring absolute yields lower. Alternatively, if inflation is stickier and Fed policy is tighter, credit fundamentals could face additional headwinds in the form of higher cost of capital. Any combination of these scenarios could make the carry thesis more difficult to defend.
Closing Thoughts
We have been through a handful of credit cycles, each one of them having their own unique features. However, there is almost always some pattern recognition, some of which we have tried to express above. Our capacity to effectively navigate credit cycles and market volatility rests on certain constants such as our time-tested investment process, a culture of investment debate and the trust and relationships we build with our investors. In our experience, staying disciplined with the mantra that discretion is the better part of valour during market environments such as this will likely have two important outcomes: 1) flexibility to invest in credit risk when valuations are more aligned with our fundamental views, and 2) provide our investors with more attractive risk-adjusted returns.
We do not profess to time the cycle. However, history has proven that trusting our investment process and staying true to discipline and patience when thinking about entry points in credit risk may not always have the short-term return outcomes that come from a reach for yield, but over the longer-term, risk-adjusted returns have more than compensated. While our current view on valuation may constrain our ability to invest with conviction in asset classes like corporate and structured credit, we think a global investable universe with increasing fundamental dispersion and idiosyncratic, industry-specific investment opportunities provide us with attractive ways to generate alpha. In this environment, we believe active management, a robust investment process across a broad, global investible universe and an unwavering focus on risk-adjusted returns, have never been more important for fixed income investors.
PORTFOLIO MANAGERS, GLOBAL SUSTAINABLE TOTAL RETURN BOND STRATEGY
Chris Diaz, CFA
Portfolio Manager
Ryan Myerberg
Portfolio Manager
Colby Stilson
Portfolio Manager
1Source: OECD Capital Market Series Dataset, LSEG. Note: refers to non-financial companies, three-year rolling averages.
Disclosures
The views expressed are those of the author and Brown Advisory as of the date referenced and are subject to change at any time based on market or other conditions. These views are not intended to be and should not be relied upon as investment advice and are not intended to be a forecast of future events or a guarantee of future results.
Past performance is not a guarantee of future performance, and you may not get back the amount invested. The information provided in this material is not intended to be and should not be considered to be a recommendation or suggestion to engage in or refrain from a particular course of action or to make or hold a particular investment or pursue a particular investment strategy, including whether or not to buy, sell or hold any of the securities or funds mentioned. It should not be assumed that investments in such securities have been or will be profitable. To the extent that specific securities are mentioned, they have been selected by the author on an objective basis to illustrate views expressed in the commentary and do not represent all of the securities purchased, sold or recommended for advisory clients. This material is intended solely for our clients and prospective clients, is for informational purposes only and is not individually tailored for or directed to any particular client or prospective client.
The information contained herein has been prepared from sources believed reliable but is not guaranteed by us as to its timeliness or accuracy and is not a complete summary or statement of all available data. The information in this document has not been independently reviewed or audited by outside certified public accountants. The information provided is not intended to be a forecast of future events or a guarantee of future results. Past performance is not indicative of future performance.;
Terms and Definitions:
“Bloomberg®” and the Bloomberg indices used in this presentation are service marks of Bloomberg Finance L.P. and its affiliates, including Bloomberg Index Services Limited (“BISL”), the administrator of the index (collectively, “Bloomberg”) and have been licensed for use for certain purposes by Brown Advisory. Bloomberg is not affiliated with Brown Advisory, and Bloomberg does not approve, endorse, review, or recommend the Brown Advisory Sustainable Core Fixed Income strategy. Bloomberg does not guarantee the timeliness, accurateness, or completeness of any data or information relating to the Brown Advisory Sustainable Core Fixed Income strategy. An investor cannot invest directly in an index.
The Bloomberg Global Aggregate - Corporate Index is a flagship measure of global investment grade, fixed-rate corporate debt. This multi-currency benchmark includes bonds from developed and emerging markets issuers within the industrial, utility and financial sectors.
The Bloomberg Global High Yield Index is a multi-currency flagship measure of the global high yield debt market. The index represents the union of the US High Yield, the Pan-European High Yield, and Emerging Markets (EM) Hard Currency High Yield Indices. The high yield and emerging markets sub-components are mutually exclusive.
Alpha is a measure of performance on a risk-adjusted basis. Alpha takes the volatility (price risk) of a portfolio and compares its risk-adjusted performance to a benchmark index.
OAS Spread (Option-Adjusted Spread) is the yield spread between a fixed-income security and a risk-free benchmark, adjusted for the value of embedded options. It reflects compensation for credit risk, liquidity risk, and optionality.
ODebt/EBITDA is a leverage ratio that compares a company’s total debt to its earnings before interest, taxes, depreciation, and amortization (EBITDA). It shows how many years it would take to pay off debt using EBITDA.
Net Debt/EBITDA is a variation of the leverage ratio that subtracts cash from total debt to reflect net debt. It measures leverage after accounting for cash reserves.
EBITDA – Capex / Net Interest is a stricter coverage ratio that accounts for capital expenditures, showing the ability to cover interest after reinvestment needs. It compares EBITDA minus capital expenditures to net interest expense.