
Fast Reading
- An artificial intelligence (AI)-driven investment boom is creating significant inflection points in credit markets, with a shift from equity-funded to debt-funded infrastructure spending, raising concerns about longer-term credit risk and financial stability.
- The rapid increase in capital intensity and shorter useful lives of AI infrastructure (like graphics processing units) compress the timeframe for returns, leading to riskier business models and a notable headwind for free cash flow generation.
- Current market behaviour echoes previous tech bubbles, with concentrated investments, ambitious projects, and growing debt mismatches; investors should remain cautious about credit valuations as risks and uncertainties rise.
Amara’s Law, which essentially states that people tend to overestimate the impact of new technology over the short term while underestimating its long-term effects, strikes us as a particularly relevant opener for a discussion of today’s AI landscape. We think AI represents a good example of a collision between microeconomics and macroeconomics, and its current and future impact on labour, capital allocation, and the broader economy certainly have the potential to be a meaningful catalyst for significant inflection points in the market.
AI-adjacent companies like the “Magnificent 7” are growing at astounding rates while benefitting from and investing in AI infrastructure to such an extent that they have become a notable driver of gross domestic product (GDP), particularly within the U.S.1 While it’s likely that AI will have a meaningful impact on the global economy and society over the long term, we think the time horizons and the nature of investments being made today invite comparisons to earlier eras of investment in transformational technology and carry increasing risks. Up until recently, funding for AI infrastructure development generally came from companies' cash flow; now we’re seeing both circular and debt-funded investments that have shifted the investment discussion from one previously centred on equity risk toward one of credit risk with wider ramifications for the economy. This inflection point offers us an opportunity to provide some thoughts on the AI investment paradigm, from our perspective as fixed income investors.
Before we get started on the discussion of inflection points, we think it’s worth highlighting our view that the magnitude of this investment boom warrants consideration of both the macroeconomic backdrop and aggregate credit valuation (“Mind the Inflection Points: Credit Valuation”). Beyond credit fundamentals, we’re finding it to be increasingly difficult to assess aggregate, company-level fundamentals in corporate America if they’re predicated on earnings or earnings per share data. We think concentration of AI-adjacent companies within stock market indices, accounting nuances associated with items like depreciation and working capital, the exclusion of investment capital, and share repurchases undermine the quality of this data. In other words, we think our traditional focus on cash flow is particularly relevant when thinking about quality of information and several features of the AI investment environment discussed below.
The pattern recognition associated with investing during the technology and telecommunications boom and bust 25 years ago is hard for us to ignore. Perhaps we should start with what we believe are some important differences between these two eras – namely, time horizon and capacity constraints. The useful life of fibre 25 years ago was much longer than the useful life of GPUs today. To us, this suggests that the necessary demand to support the needed return on invested capital has a higher degree of urgency, and therefore a shorter fuse, associated with it; not to mention the magnitude of the necessary return realization. Unlike 25 years ago, today, we’re faced with constraints on growth driven by factors like energy. It’s not yet clear to us that current plans for development and investment can be accommodated by innovation and/or the growth capacity of the required energy infrastructure. We also think there are important similarities between these two investment eras, such as the massive scale of investments being made in the infrastructure to support anticipated and extraordinary levels of bandwidth or training/inference demand, which concentrate investments and short-term performance in these areas of the economy. Investment within AI infrastructure is discussed in terms of trillions of dollars over the coming years. If we think about the traditional numerator in the fraction representing return on invested capital (net operating profit after taxes, or NOPAT) as a fraction of revenue, it’s difficult for us to wrap our heads around the magnitude of demand and efficiency gains required to produce a reasonable rate of return on this invested capital in relatively shorter periods of time.
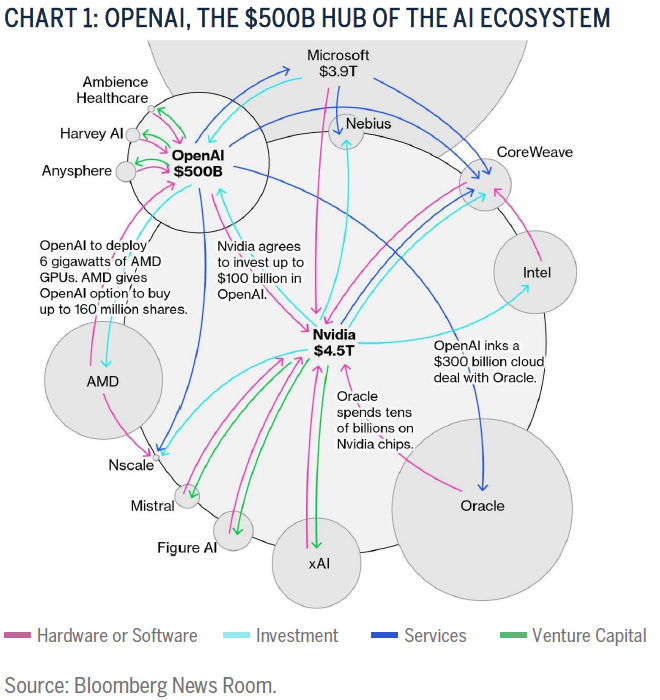
Additionally, the nature of AI investments has been changing, leading us to see more parallels between these two investment eras. We’re seeing circular funding exercises involving the likes of Advanced Micro Devices (AMD), CoreWeave, Intel, Microsoft, Nvidia, OpenAI, and Oracle that are reminiscent of 2000-era investment behaviour. In short, it’s not clear to us that the supply-demand activity that underlies traditional revenue contracts is holding up when many of the revenue commitments have varying degrees of uncertainty and are tied to purchase commitments and equity investments. There is even an increasingly popular acronym associated with potential revenue called a “revenue performance obligation” (RPO) that raises our eyebrows when thinking about the free cash flow profiles (or lack thereof) of obligors like CoreWeave, Intel, OpenAI, and Oracle.
Another example of how these two investment eras are converging is the introduction of debt-funded investments within public and private credit markets. In the public markets this year, we’ve seen sizeable issuance from the likes of Alphabet ($25B), Meta ($30B), and Oracle ($26B) with maturities as long as 50 years. There are eerily similar echoes to the early-2000's era, with special purpose vehicles entering the investment lexicon both in structure and in name. Meta recently partnered with a private capital provider called Blue Owl to raise $27B of debt in a financing vehicle called Beignet Investor LLC that was structured away from Meta’s balance sheet to fund a datacentre project in Louisiana called “Hyperion.”2 Speaking of names and pattern recognition, a sampling of recent datacentre projects speaks for itself: Colossus, Prometheus, Stargate and Zodiac. Lofty and grand names for lofty and grand ambitions and expectations.
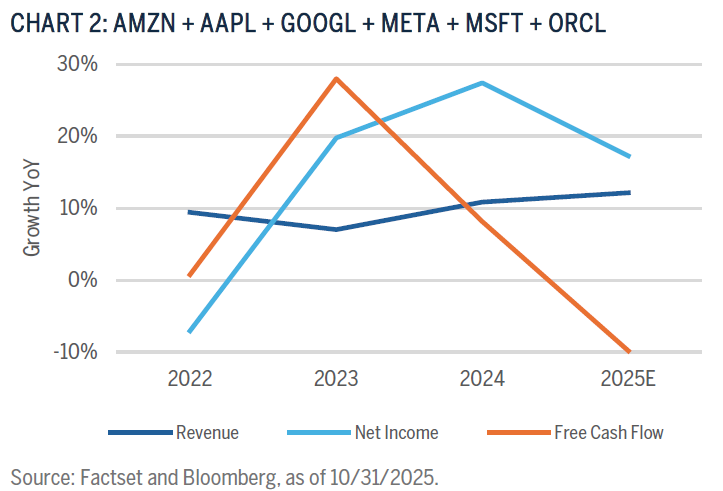
These trends are having meaningful impacts on business models and balance sheets within the AI-adjacent economy. We’ve argued that the shorter, relative average life of GPUs compresses the window of time to meet required returns, and we would add that the debt being raised to finance these investments comes with maturities well beyond the average lives of the assets being purchased. We see increasingly risky financial profiles when considering the need for demand and/or efficiency realization amidst a duration mismatch between assets and liabilities and fixed costs in the form of interest payments. Many of these companies are also experiencing capital intensity that has the potential to change their business models, which is starting to manifest in their financial statements. When looking at a summation of revenue, net income and free cash flow growth of a cloud-related subset of the Magnificent 7, we can see in Chart 2 that free cash flow growth is declining significantly compared to that of net income, while revenue growth is staying relatively flat. There are several accounting-related arguments explaining the difference between net income and free cash flow, but we’re focused on the trend of declining free cash flow driven by an explosive expansion of capital expenditures. This shift suggests to us that these business models, which previously benefited from lower capital intensity and intangible assets, are evolving toward more traditional business models with lower profitability and scaling potential.
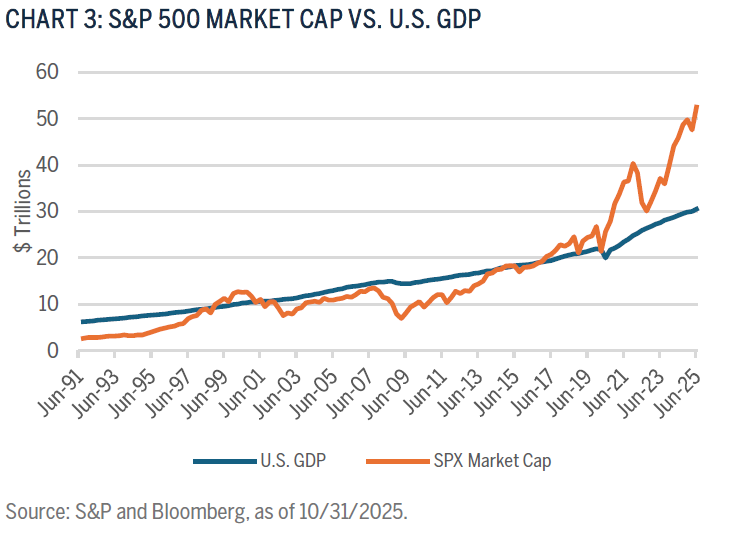
The macroeconomic discussion surrounding AI can also be captured in Chart 3, which shows the S&P 500® Index market capitalization versus nominal U.S. GDP. It’s clear that current valuation far exceeds that of the U.S. economy. As it relates to AI, given the asymmetric distribution of returns within our asset class – where the upside is relatively limited and downside can be zero – our bondholder mindset is sometimes inescapable when contemplating investment paradigms like this.
We think the overindulgence in words like “peak” and “bubble” isn’t particularly constructive; however, we are comfortable suggesting that risk levels are increasing, and we’ve seen enough pattern recognition to reinforce our view that credit valuation currently has too much downside skew to support high-conviction decisions surrounding asset allocation to credit risk. We are finding idiosyncratic opportunities to invest in credits that have exposure to AI; however, these inflection points create more sensitivity surrounding these investment theses. Interestingly, these large technology businesses have not been compelling investments for us as bondholders given very little leverage and thin credit spreads – if the above trends continue, perhaps these businesses enter our addressable market of investments (assuming spreads reflect our view of the fundamentals, of course).
In addition to monitoring the above risks within the AI ecosystem, we’re focused on potential impacts on inflationary trends in the macroeconomy, including construction supply chains, labour markets, energy and utilities markets, the microeconomic assessment of the various forms of AI adoption as driving forces behind the return on invested capital, and the animal spirits that typically come along with investment eras like this.
As always, we’re keen to debate this important topic, so please reach out to us at any time.
PORTFOLIO MANAGERS, GLOBAL SUSTAINABLE TOTAL RETURN BOND STRATEGY
Chris Diaz, CFA
Portfolio Manager
Ryan Myerberg
Portfolio Manager
Colby Stilson
Portfolio Manager
1“Magnificent 7” stocks: Alphabet, Amazon, Apple, Meta, Microsoft, NVIDIA and Tesla. 2Meta Investor Relations, Meta Announces Joint Venture with Funds Managed by Blue Owl Capital to Develop Hyperion Data Center, as of 10/21/2025.
Disclosures
The views expressed are those of the author and Brown Advisory as of the date referenced and are subject to change at any time based on market or other conditions. These views are not intended to be and should not be relied upon as investment advice and are not intended to be a forecast of future events or a guarantee of future results.
Past performance is not a guarantee of future performance, and you may not get back the amount invested.
The information provided in this material is not intended to be and should not be considered to be a recommendation or suggestion to engage in or refrain from a particular course of action or to make or hold a particular investment or pursue a particular investment strategy, including whether or not to buy, sell or hold any of the securities or funds mentioned. It should not be assumed that investments in such securities have been or will be profitable. To the extent that specific securities are mentioned, they have been selected by the author on an objective basis to illustrate views expressed in the commentary and do not represent all of the securities purchased, sold or recommended for advisory clients. This material is intended solely for our clients and prospective clients, is for informational purposes only and is not individually tailored for or directed to any particular client or prospective client.
The information contained herein has been prepared from sources believed reliable but is not guaranteed by us as to its timeliness or accuracy and is not a complete summary or statement of all available data. The information in this document has not been independently reviewed or audited by outside certified public accountants. The information provided is not intended to be a forecast of future events or a guarantee of future results. Past performance is not indicative of future performance.
Terms and Definitions:
The S&P 500® Index is a capitalization weighted index of 500 stocks that is designed to measure performance of the broad domestic economy through changes in the aggregate market value of 500 stocks representing all major industries. Index returns assume reinvestment of dividends and do not reflect any fees or expenses. An investor cannot invest directly into an index. Benchmark returns are not covered by the report of the independent verifiers.
Standard & Poor’s, S&P®, and S&P 500® are registered trademarks of Standard & Poor’s Financial Services LLC (“S&P”), a subsidiary of S&P Global Inc.
Return on Invested Capital (ROIC) measures how much profit a company earns on its invested capital in a given year. It is calculated as a percentage of a company's net operating profit after tax divided by its average invested capital.
Free cash flow (FCF) represents the cash a company generates after cash outflows to support operations and maintain its capital assets. Unlike earnings or net income, free cash flow is a measure of profitability that excludes the non-cash expenses of the income statement and includes spending on equipment and assets as well as changes in working capital.
Market Capitalization refers to the aggregate value of a company’s publicly-traded stock. Statistics are calculated as follows: Weighted Average: the average of each holding’s market cap, weighted by its relative position size in the portfolio (in such a weighting scheme, larger positions have a greater influence on the calculation); Weighted Median: the value at which half the portfolio's market capitalization weight falls above and half falls below; Maximum and Minimum: the market caps of the largest and smallest companies, respectively, in the portfolio.