
Fast Reading:
- Mid-caps have historically provided the best absolute and risk-adjusted returns across U.S. equities, providing significant upside to large-caps with limited additional risk.
- Mid-cap equities fill a structural gap between large-cap stability and small-cap innovation. They provide exposure to companies with proven business models yet meaningful growth potential, complementing allocations across the market-cap spectrum.
- Current market concentration in trillion-dollar tech names has left investors underexposed to this historically attractive asset class, which offers broader exposure to the U.S. economy while still benefiting from the secular growth themes driving the market.
After another year where trillion-dollar companies dominated investors’ attention and dictated market behavior, allocators are recognizing that now marks an opportune moment to revisit their exposure beyond these mega-cap stocks. Mid-cap equities have historically provided attractive diversification benefits in portfolios, and we believe it could be a prudent time for investors to refocus on their allocation down the U.S. equity market cap spectrum.
Mid-caps are an exciting part of the U.S. equity market and sit at the intersection of high-growth potential with mature and proven business models. The asset class has historically offered attractive prospects for allocators, providing significant upside potential with a risk profile similar to large-cap equities.
The Brown Advisory Mid-Cap Growth Strategy seeks to capitalize on this opportunity set, identifying companies with durable and scalable business models, attractive growth prospects and led by capable management teams. From a universe that can be described as “non-large-cap”, we seek to uncover the medium and smaller-sized companies that have the potential to become much larger in the future and drive returns over a multi-year period.
A Prudent Time To Revisit Mid-Cap Equities
In our view, mid-caps merit a strategic and long-term allocation in an investor’s portfolio and now could be an opportune time to rethink portfolio composition by adding or increasing exposure to mid-caps. With the broader market driven by just a handful of mega-cap companies, investors can build more diversified exposure to the U.S. economy by venturing further down the market cap spectrum.
Mid-Caps Offer Broader Economic Exposure Than Large-Caps
Given the concentration of trillion-dollar technology-oriented companies, large-cap equity allocations have become highly levered to that segment. While still providing access to the growth potential of technology companies, the mid-cap universe offers broader economic exposure, which results in a more diversified pool of investment opportunities. At the end of December, the Technology sector represented over 40% of the S&P 500® Index. Amazon and Tesla, commonly considered technology companies are classified as Consumer Discretionary, but adding both brings the S&P 500® technology exposure to nearly 47% (Fig. 1).
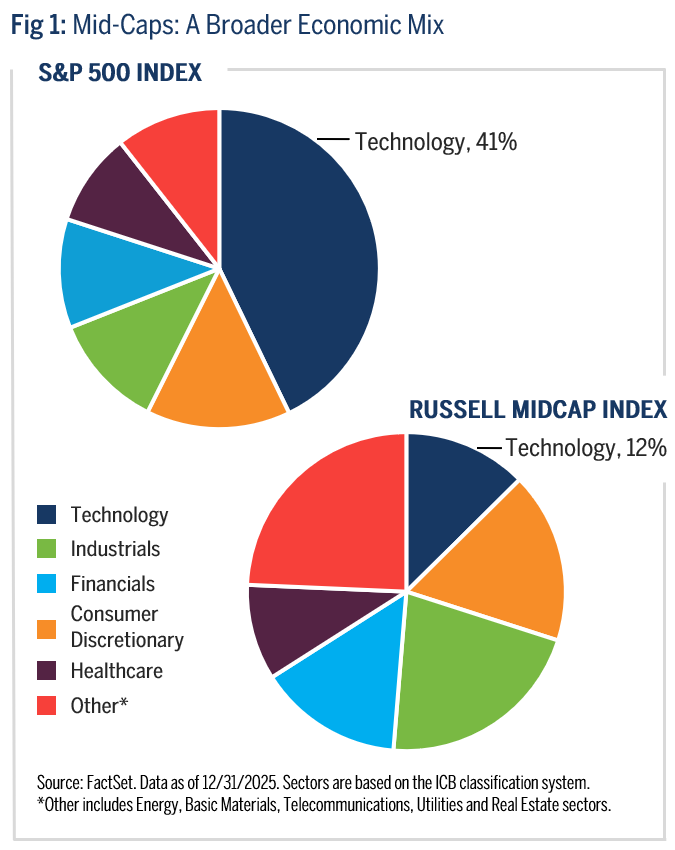
On the other hand, the Russell Midcap® Index is more evenly distributed, with no single sector encompassing more than 21%. While large-cap exposure to the AI/data center arms race is primarily concentrated within the chip makers and hyperscalers, mid-caps offer a diversified exposure to the theme as well, with names across the Technology, Industrials and Utilities sectors.
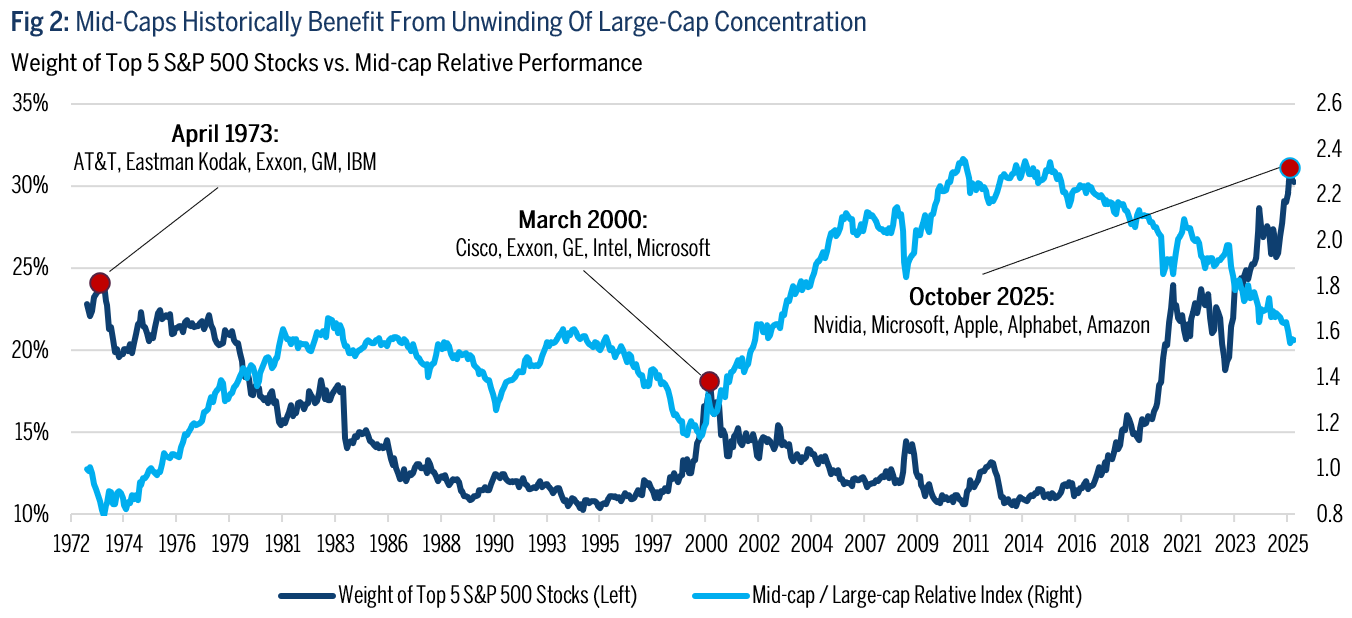
De-Concentration Out Of Mega-Caps Would Benefit Mid-Caps
The historically high level of concentration among large-cap U.S. equities is not new news for investors, yet they may not have considered what could happen if capital begins to flow elsewhere. In the past, when higher-than-typical levels of concentration start to unwind, it has sparked a multi-year cycle of relative outperformance for mid-caps versus large-caps. While we are not suggesting an imminent mass exodus from these mega-cap leaders, rising concentration concerns may prompt some investors to pare back their exposure, creating a pool of funds ripe for reallocation.
Source: Furey Research Partners, FactSet; as of 12/31/2025 ; Mid-caps: CRSP 3-5 Decile Index (1950-1979), Russell Midcap® Index (1979-Present); Large-caps: S&P 500® Index (All Periods)
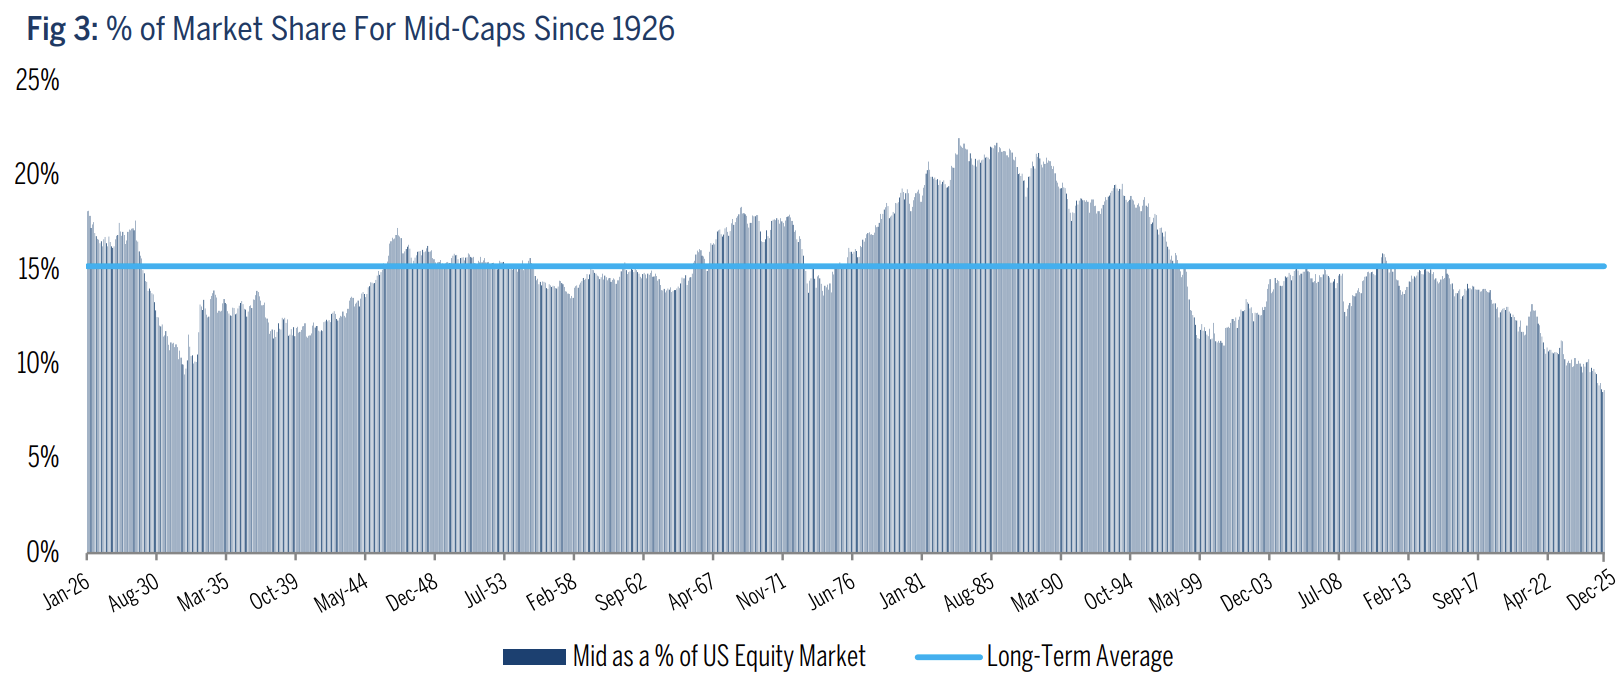
Passive Large-Cap Allocations No Longer Provide The Mid-Cap Exposure They Once Did
It is becoming increasingly challenging for large-cap managers to provide exposure to mid-cap equities due to the ongoing gravitational pull of mega-cap stocks. While investors were once able to gain exposure to mid-caps through their large-cap allocation, the reality is that today such strategies are increasingly pulled away from the space. Although some active large-cap managers maintain exposure to mid-caps, passive approaches to U.S. large-caps leave investors significantly underweight this historically attractive asset class. In fact, at around just 9%, the proportion of mid-cap equities within the total market has fallen to its lowest level in almost a century (Fig. 3). A direct allocation to mid-caps can ensure portfolios are not unintentionally left under-exposed to this segment.
Source: Center for Research in Security Prices (CRSP®), The University of Chicago Booth School of Business; Jefferies. Updated through December 31, 2025.
Note: Mid represents deciles 3-5 based on Market Capitalization.
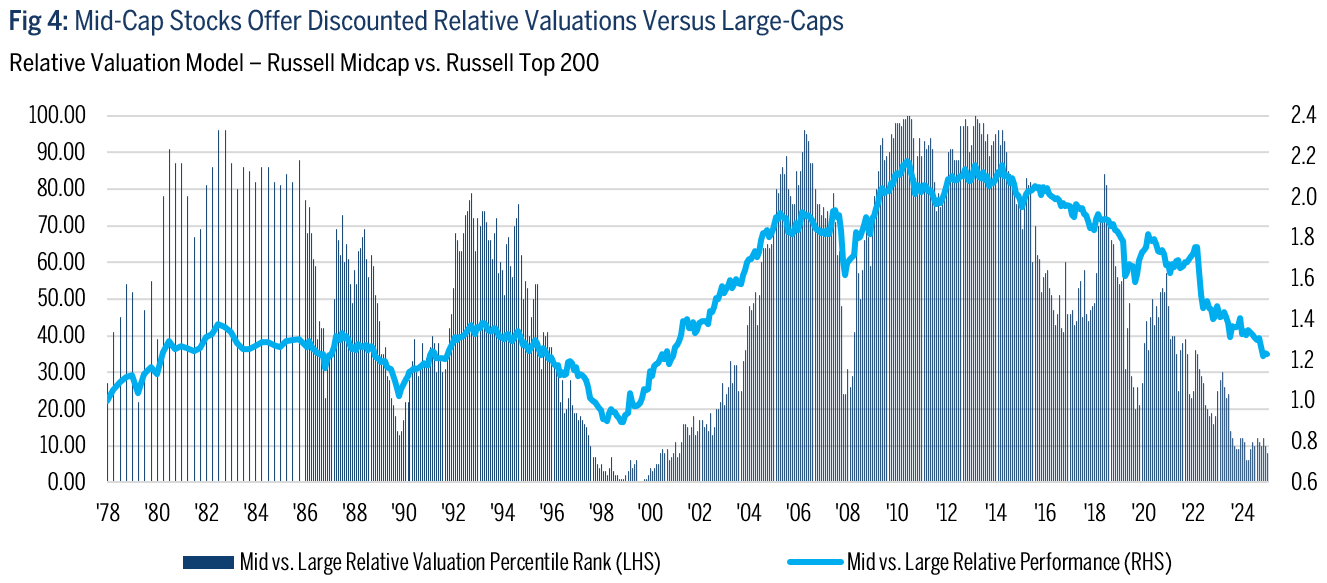
Mid-Caps Are Historically Cheap Relative to Large-Caps
The valuation of U.S. stocks has become a core topic of discussion. Regardless of whether valuations of large-cap companies are currently excessive or not, data clearly shows that the valuations of mid-caps are historically cheap compared to their large-cap peers. The late 1990s was the last time the valuation gap was this steep, and a decade of mid-cap outperformance followed (Fig. 4). The valuation question is unlikely to be the sole catalyst for a resurgence in mid-cap equities but combined with the other tailwinds outlined in this piece, there are compelling reasons to anticipate another extended period of relative outperformance.
Source: FactSet; Jefferies as of December 31, 2025.
Note: Relative valuation model is the Russell Midcap Index vs. Russell Top 200 Index. Relative valuation model consists of relative Trailing and Forward P/E, Price to Book, Price To Sales and from 2002 Price to Cash Flow; from March 31, 2016 forward Jefferies' estimates. Model updated on a quarterly frequency through 1986, monthly frequency after.
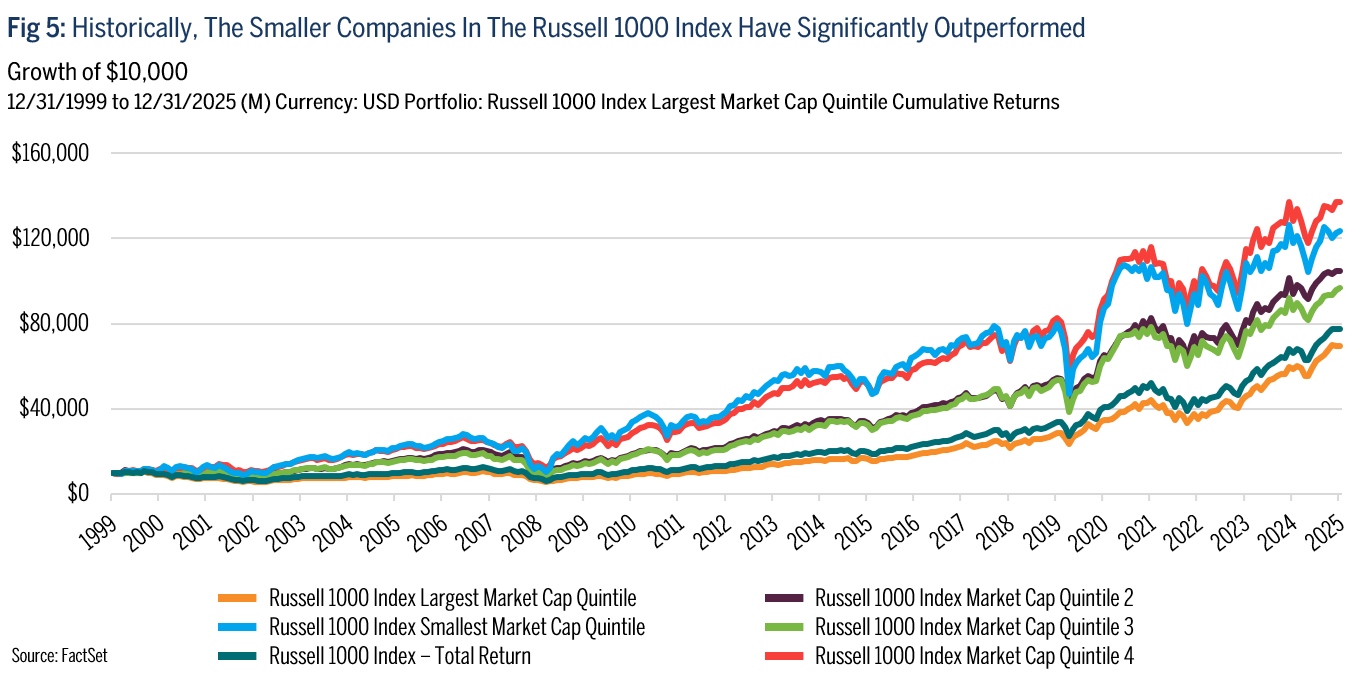
Size Hasn’t Always Mattered
Another market anomaly from recent years is the consistent outperformance of some of the largest companies, which have seemingly escaped the law of large numbers. History shows us that the mid-cap companies in the Russell 1000® Index have generated the best absolute and risk-adjusted returns over the long term. In particular, over the last twenty-five years, it has been the smallest names in the Russell 1000 Index that have significantly outperformed the largest ones, raising the question of how long the mega-cap outperformance anomaly can persist. (Fig. 5).
The Case For Mid-Cap Growth As A Strategic Allocation
Despite their strong diversification benefits, U.S. mid-caps are typically underrepresented in portfolios. We feel their balanced risk-return profile and historical outperformance over long periods provide a compelling argument for including mid-cap equities within strategic allocations. Moreover, these assets are far less covered by analysts relative to large-caps, creating more opportunities for active management and alpha generation.
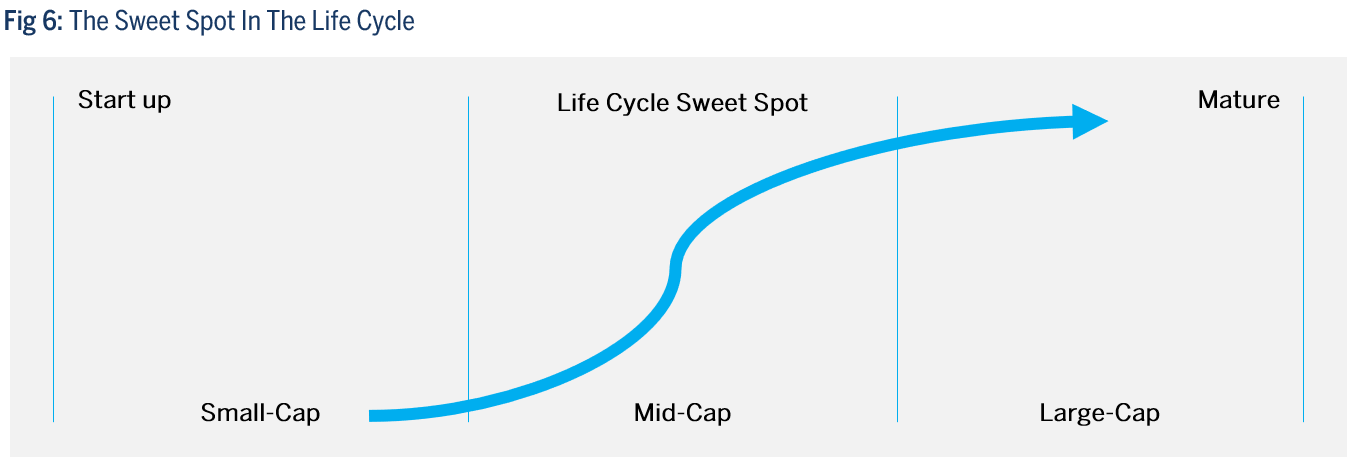
Mid-Caps Intersect Potential Growth With Proven Business Models
The mid-cap stage is often referred to as a sweet spot in a company’s life cycle (Fig 6). No longer possessing the risks associated with early-stage companies, they have proven business models and management teams, and yet they still offer the potential for significant growth. Additionally, due to their relatively small size, they tend to be more nimble than their large-cap peers, enabling them to react more quickly to changing market dynamics.
Source: Brown Advisory.
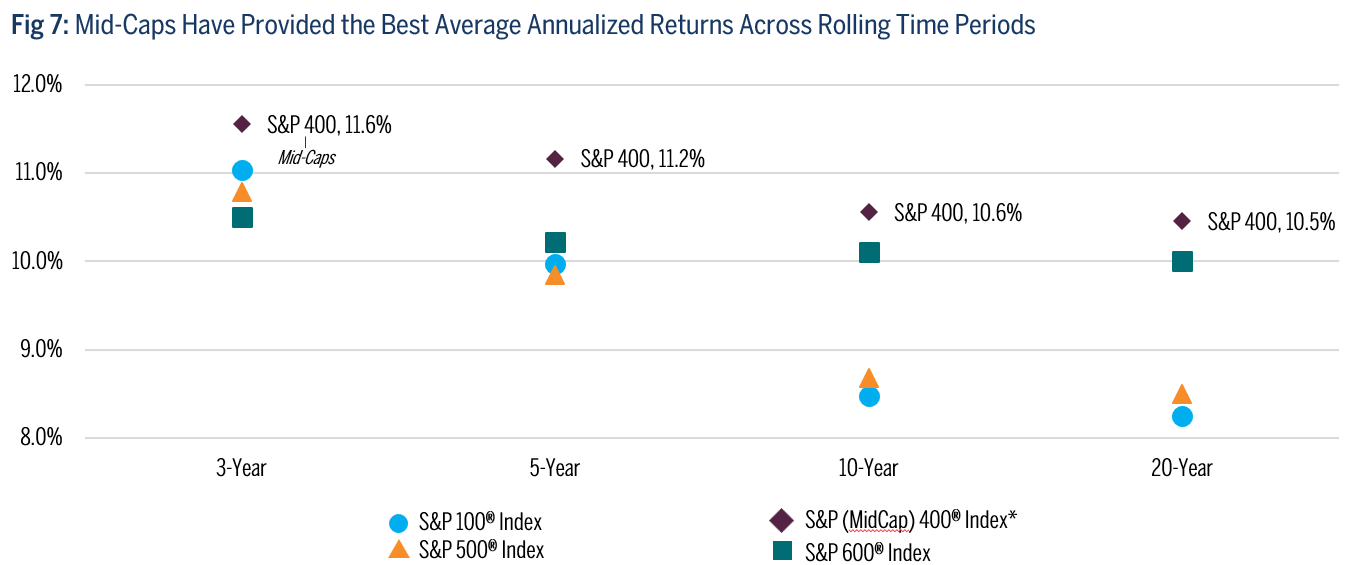
Attractive Risk-Return Profile
Historically, mid-caps have also offered the most attractive risk-reward profile among the U.S. equity segments. Over the last 100 years, they have delivered similar returns to small-cap stocks, at a risk level more akin to large-caps. In fact, according to Jefferies, since 1925, mid-caps have delivered 85% of the returns of small-caps, with just 15% of the risk. More recently, and using the S&P Indices as a proxy, mid-caps have provided the best performance, on average, across all time periods (Fig. 7).
Source: FactSet. Data as of 12/31/2025.
*The S&P 400® Index is formally known as the S&P MidCap 400 Index.
The Brown Advisory Mid-Cap Growth Approach
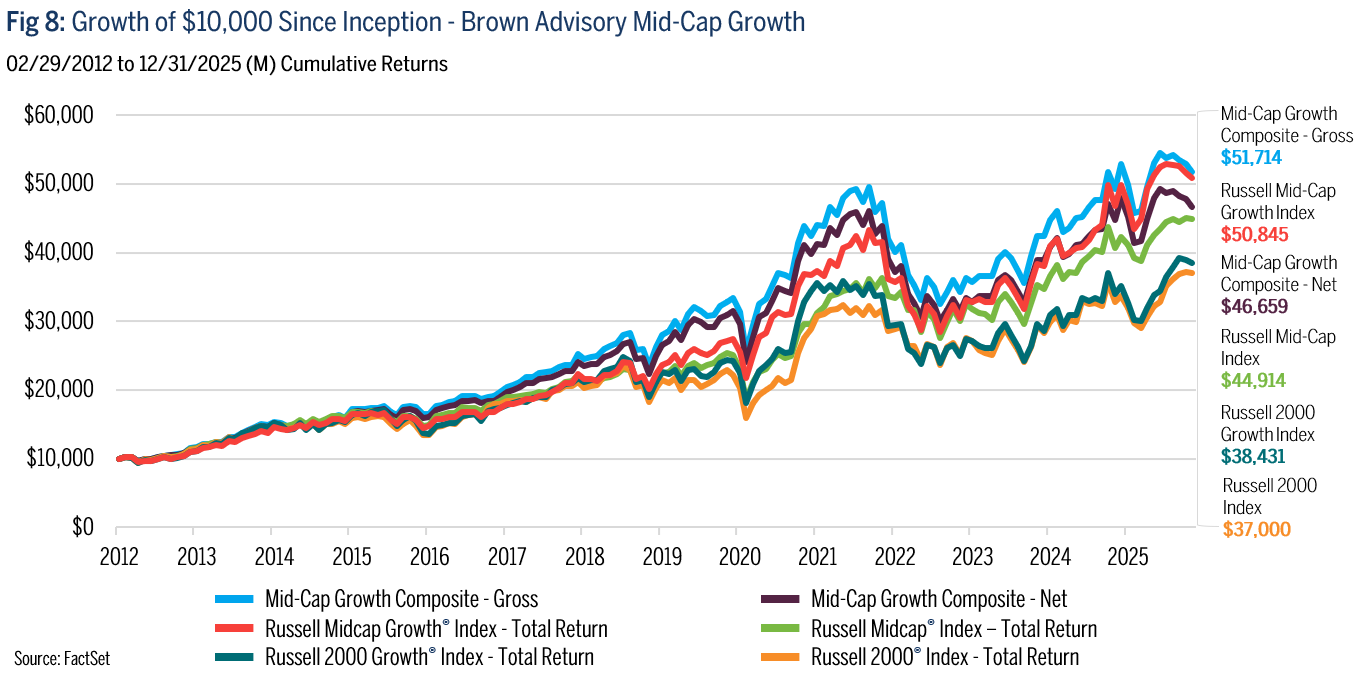
Brown Advisory has a long history of investing in small and mid-cap companies. We describe our mid-cap growth strategy as applying a non-large-cap approach, and our investment universe spans a wide range of capitalizations, initiating new positions in companies between $2 to $50 billion. The resultingportfolio provides exposure to small, SMID, and mid-cap companies and we have historically done well against all the Russell non-large-capbenchmarks (Fig. 8).
Our due diligence process is built on this small-cap heritage, creating a foundation that has been developed over decades of experience and implemented by a large team of analysts and portfolio managers. By interviewing hundreds of companies per year, we seek to continuously augment our institutional knowledge of the U.S. “non-large-cap” space to help better understand secular trends and anticipate changes across industries.
Identifying companies that we believe can outperform across our broad opportunity set is a labor-intensive process, but one that can generate meaningful alpha over time. Many mid-sized companies tout growth potential, but the process whereby it materializes may be non-linear and occasionally falters entirely. Other times, growth comes at the expense of profits and scale, and almost never translates into shareholder returns. Occasionally, business prospects are recognized so quickly that a company’s enterprise value compounds through the entire mid-cap range in one or two years. Assessing the growth potential, quality and scalability of these companies is therefore crucial for investors considering non-large-caps.
Conclusion
U.S. equity market investors sit at an exciting crossroads. The appeal of the trillion-dollar companies remains compelling and could continue to dominate markets for the foreseeable future. Yet, concerns about high concentration, excessive valuations and a lack of diversification are weighing on investors, who are beginning to ask how long this current trend can persist.
For those rethinking their asset allocation, mid-cap equities offer an attractive option. They offer broad exposure to the U.S. economy and are set up well should assets start to flow away from mega-caps. Taking a longer-term view, mid-caps have delivered the strongest returns of all the U.S. equity segments across all time periods, with limited additional risk relative to large-caps.
Our mid-cap growth strategy has a long track record of identifying high-quality mid-cap companies capable of compounding over time. We believe this pedigree positions us well to take advantage of any upcoming opportunities in 2026 and beyond.
Disclosures
Click here to access the Brown Advisory Mid-Cap Composite.
The views expressed are those of the author and Brown Advisory as of the date referenced and are subject to change at any time based on market or other conditions. These views are not intended to be a forecast of future events or a guarantee of future results. Past performance is not a guarantee of future performance and you may not get back the amount invested. The information provided in this material is not intended to be and should not be considered to be a recommendation or suggestion to engage in or refrain from a particular course of action or to make or hold a particular investment or pursue a particular investment strategy, including whether or not to buy, sell, or hold any of the securities mentioned. It should not be assumed that investments in such securities have been or will be profitable. To the extent specific securities are mentioned, they have been selected by the author on an objective basis to illustrate views expressed in the commentary and do not represent all of the securities purchased, sold or recommended for advisory clients. The information contained herein has been prepared from sources believed reliable but is not guaranteed by us as to its timeliness or accuracy, and is not a complete summary or statement of all available data. This piece is intended solely for our clients and prospective clients, is for informational purposes only, and is not individually tailored for or directed to any particular client or prospective client.
FactSet® is a registered trademark of FactSet Research Systems, Inc.
The Russell 1000® Index represents the top 1000 companies by market capitalization in the United States. The index is a subset of the Russell 3000 Index. The Russell 2000® Index measures the performance of the small-cap segment of the U.S. equity universe.
The Russell Top 200® Index measures the performance of the largest cap segment of the U.S. equity universe. The Russell Top 200 Index is a subset of the Russell 3000® Index. It includes approximately 200 of the largest securities based on a combination of their market cap and current index membership and represents approximately 68% of the Russell 3000® Index, as of the most recent reconstitution.
The Russell Midcap® Index measures the performance of the mid-cap segment of the U.S. equity universe. The Russell Midcap Index is a subset of the Russell 1000® Index. It includes approximately 800 of the smallest securities based on a combination of their market cap and current index membership. The Russell Midcap® Index represents approximately 27% of the total market capitalization of the Russell 1000® companies, as of the most recent reconstitution. The Russell Midcap Index is constructed to provide a comprehensive and unbiased barometer for the mid-cap segment. The index is completely reconstituted annually to ensure larger stocks do not distort the performance and characteristics of the true midcap opportunity set.
The Russell Midcap® Growth Index measures the performance of the midcap growth segment of the US equity universe. It includes those Russell Midcap Index companies with relatively higher price-to-book ratios, higher I/B/E/S forecast medium term (2 year) growth and higher sales per share historical growth (5 years). The Russell Midcap Growth Index is constructed to provide a comprehensive and unbiased barometer of the mid-cap growth market. The index is completely reconstituted annually to ensure larger stocks do not distort the performance and characteristics of the true mid-cap growth market.
The Russell 2000® Index measures the performance of the small-cap segment of the U.S. equity universe. The Russell 2000 Index is a subset of the Russell 3000® Index which is designed to represent approximately 98% of the investable U.S. equity market. It includes approximately 2,000 of the smallest securities based on a combination of their market cap and current index membership. The Russell 2000 is constructed to provide a comprehensive and unbiased small-cap barometer and is completely reconstituted annually to ensure larger stocks do not distort the performance and characteristics of the true small-cap opportunity set.
The Russell 2000® Growth Index measures the performance of the small-cap growth segment of the U.S. equity universe. It includes those Russell 2000 Index companies with higher price-to-value ratios and higher forecasted growth values. The Russell 2000® Index consists of the smallest 2,000 companies in a group of 3,000 U.S. companies in the Russell 3000 Index, as ranked by market capitalization.
Frank Russell Company (“Russell”) is the source and owner of the trademarks, service marks and copyrights related to the Russell Indexes. Russell® is a trademark of Frank Russell Company. Neither Russell nor its licensors accept any liability for any errors or omissions in the Russell Indexes and / or Russell ratings or underlying data and no party may rely on any Russell Indexes and / or Russell ratings and / or underlying data contained in this communication. No further distribution of Russell Data is permitted without Russell’s express written consent. Russell does not promote, sponsor or endorse the content of this communication.
London Stock Exchange Group plc and its group undertakings (collectively, the “LSE Group”). © LSE Group 2021. FTSE Russell is a trading name of certain of the LSE Group companies. “FTSE®” “Russell®”, “FTSE Russell®”, “ICB®”, are trademarks of the relevant LSE Group companies and are used by any other LSE Group company under license. All rights in the FTSE Russell indexes or data vest in the relevant LSE Group company which owns the index or the data. Neither LSE Group nor its licensors accept any liability for any errors or omissions in the indexes or data and no party may rely on any indexes or data contained in this communication. No further distribution of data from the LSE Group is permitted without the relevant LSE Group company’s express written consent. The LSE Group does not promote, sponsor or endorse the content of this communication.
The S&P 100® Index is a sub-set of the S&P 500 designed to measure performance large-cap companies in the U.S. and comprises 100 major blue chip companies cross multiple industry groups. The S&P 100 consists of 100 companies selected from the S&P 500. To be included, the stocks should be among the larger and more stable companies in the S&P 500.
The S&P 400® Index, formally known as the S&P MidCap 400, is a U.S. stock market index that measures the performance of 400 mid-capitalization companies.
The S&P 500® Index is a capitalization weighted index of 500 stocks that is designed to measure performance of the broad domestic economy through changes in the aggregate market value of 500 stocks representing all major industries. Index returns assume reinvestment of dividends and do not reflect any fees or expenses. An investor cannot invest directly into an index. Benchmark returns are not covered by the report of the independent verifiers.
The S&P 600® Index, formally known as the S&P SmallCap 600, measures the performance of 600 small-capitalization U.S. companies. It represents the small-cap segment of the U.S. equity market and is designed to reflect companies with strong liquidity and financial viability.
Standard & Poor’s, S&P®, and S&P500® are registered trademarks of Standard & Poor’s Financial Services LLC (“S&P”), a subsidiary of S&P Global Inc.
The CRSP 3-5 Decile Index is a market capitalization-weighted index that tracks the performance of mid-cap stocks within the U.S. equity market. The total universe of stocks is segmented into 10 equal groups, or deciles, with each decile representing 10% of the total market capitalization. The deciles are ordered from 1 (largest market capitalization) to 10 (smallest market capitalization).The CRSP 3-5 Decile Index specifically comprises companies that fall into the 3rd, 4th, and 5th deciles of this ranking system.
Annualized Return is the geometric average amount of money earned by an investment each year over a given time period. It is calculated as a geometric average to show what an investor would earn over a period of time if the annual return was compounded. Market Capitalization refers to the aggregate value of a company’s publicly-traded stock. Statistics are calculated as follows: Weighted Average: the average of each holding’s market cap, weighted by its relative position size in the portfolio (in such a weighting scheme, larger positions have a greater influence on the calculation); Weighted Median: the value at which half the portfolio's market capitalization weight falls above and half falls below; Maximum and Minimum: the market caps of the largest and smallest companies, respectively, in the portfolio. Relative valuation is a valuation technique that helps investors determine the value of a company. They achieve this through comparison with similar companies. Forward P/E Ratio is determined by dividing the price of the stock by the company's forecasted earnings per share. Trailing price-to-earnings (P/E) is a relative valuation multiple that is based on the last 12 months of actual earnings. It is calculated by taking the current stock price and dividing it by the trailing earnings per share (EPS) for the past 12 months. The price-to-sales (P/S) ratio is a powerful tool for investors aiming to evaluate stock value by measuring the relationship between a company's stock price and its revenue. The Price-to-Cash Flow (P/CF) Ratio offers investors a way to measure a stock's market value against its operating cash generation. This useful metric factors in non-cash expenses to present a clearer financial picture, particularly valuable in analyzing companies with large non-cash charges.