
Fast Reading
- The energy shock is accelerating investment in reliable, affordable and localized energy systems as AI infrastructure drives power demand higher and geopolitical risks increase.
- Energy security is supporting greater investment in efficiency, circularity, electrification, clean energy and conventional supply, as governments increasingly frame these areas as economic and national security priorities.
- Siemens Energy, Eastman, ReNew Energy Global and SQM illustrate potential opportunities across grid resilience, recycled materials, renewable power and critical mineral supply chains as companies and countries seek more resilient energy systems.
As discussed in the first part of our Energy Resilience Meets AI series, the buildout of artificial intelligence (AI) is creating a new kind of energy demand: large, concentrated, power-hungry and highly sensitive to the cost and reliability of electricity. The International Energy Agency expects global data-center electricity demand to more than double by 2030 to about 945 terawatt-hours, more than Japan’s total electricity consumption today. The United States accounts for the largest share of the increase, with electricity consumed for data centers likely to outpace the production of aluminum, steel, cement, chemicals, and all other energy-intensive goods combined by 2030. However, this is not solely a United States phenomenon. Countries around the world are scrambling to position themselves to benefit from the AI era.1
Against this backdrop, the energy supply shock driven by the war in Iran should be viewed less as a temporary commodity event and more as an accelerant of a broader investment cycle within energy resilience. As the world grapples with rising demand for energy driven by the AI infrastructure buildout alongside an unprecedented energy shock and rising geopolitical risk, companies and countries are acutely focused on energy security, where access to reliable, affordable and localized energy and supply chains has become a strategic advantage.
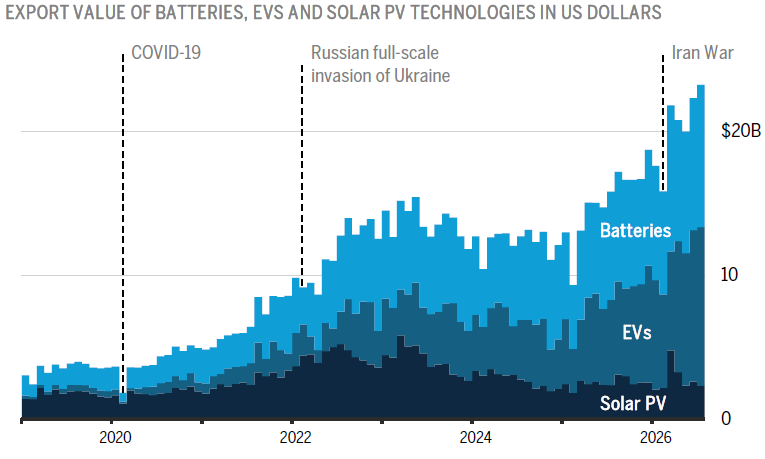
CHART 1: Chinese Clean Tech Exports Exceeded $20bn in March
Source: Ember, as of July 31, 2026; https://ember-energy.org/data/china-cleantech-export-data/.
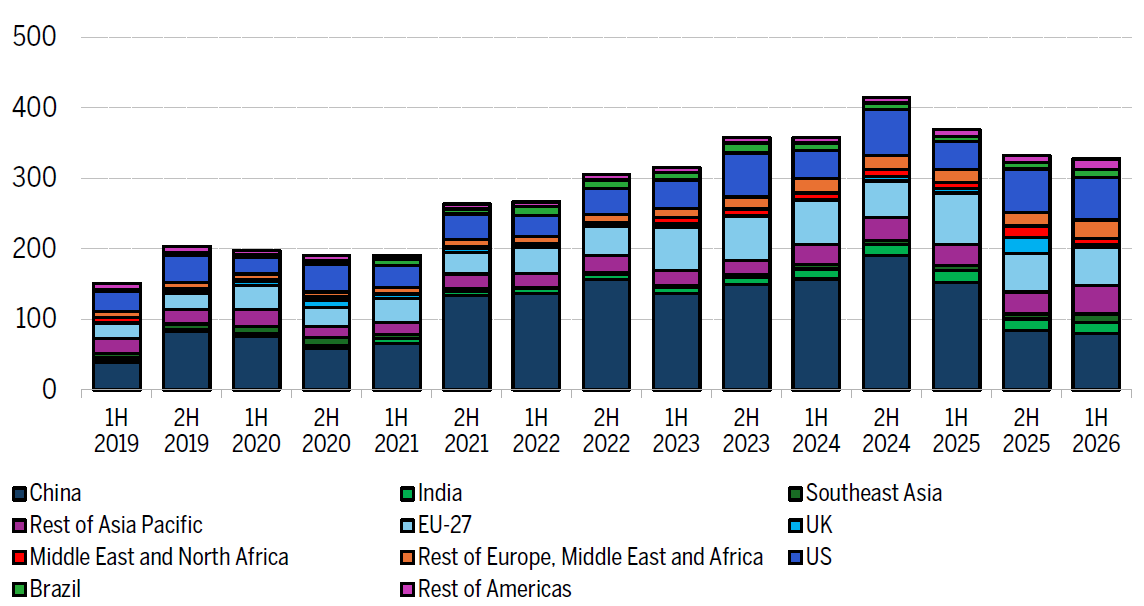
From a macro perspective, we have seen governments around the world announce new measures to increase or accelerate investment in these areas in the name of security. Global exports of EVs, lithium-ion batteries, and solar from China surged in the first half of 20262 and renewables investment outside of China reached a new record.3 Europe, already learning lessons from the previous energy shock at the onset of the Russia-Ukraine war, has continued to highlight the importance of reducing reliance on imported fuels. Since 2022, the EU has cut gas consumption by 13% as a result of greater investment in efficiency and clean energy.4 The EU estimates that 70%5 of power produced in the bloc already comes from local, clean sources, but electrification is emerging as a growing area of opportunity. The electrification rate (share of electricity in final energy consumption) has been stagnant at 23% for a decade, compared to more than 30% in China, Korea or Japan.6 Meanwhile in Asia, while leading on electrification, they are still one of the most dependent regions in the world on energy imports, and as a result, have been the most active in launching new strategic initiatives since the start of the Iran conflict aimed at accelerating investment in clean, localized sources of energy, and improving the circularity and efficiency of industrial processes (e.g., China's AI-Energy Action Plan and Japan's Circular Economy Action Plan). Importantly, these initiatives have been launched in the name of national and economic security, rather than climate policy.
CHART 2: Renewables Investment Outside China at a Record ($ Billion)
Source: BloombergNEF, Renewable Energy Investments Show One Booming Sector, as of August 26, 2026: https://about.bnef.com/insights/clean-energy/renewable-energy-investments-show-one-booming-sector/.
While there is much uncertainty surrounding how long the current conflict will last, this reframing of energy resilience as a security imperative is creating opportunities for companies that are helping customers improve efficiency, increase circularity, and build energy systems that will be more resilient in an increasingly volatile environment in which so-called "shocks" may become more frequent with energy prices potentially staying higher for longer.
Case Studies
Energy Efficiency and Grid Resilience: Siemens Energy
Siemens Energy operates across much of the energy value chain, supplying gas and steam turbines, generators, transformers, transmission equipment and wind turbines. As an equipment and services provider rather than a fuel producer, Siemens Energy is less directly exposed to the price of any single energy source and is positioned to benefit as countries invest in dispatchable generation, renewable integration and more resilient transmission networks, supporting a multi-year investment cycle in power generation and grid infrastructure.
Higher and more volatile fuel prices strengthen the customer economics of Siemens Energy’s efficiency technologies. Its combined-cycle gas plants can achieve efficiencies above 64%, allowing customers to generate more electricity from the same amount of fuel.7 As an illustration, increasing efficiency from 55% to 64% could reduce fuel consumption per unit of electricity by approximately 14%.8 Maintenance, efficiency upgrades, and turbine modernization can also improve the efficiency and availability of the existing installed base, at margin accretive levels, providing customers with a tangible return through lower fuel costs and reduced exposure to supply disruptions.
At the same time, electrification, renewable deployment, and AI-related data center demand are increasing pressure on already constrained power networks. Siemens Energy’s transformers, substations, and high-voltage direct-current systems help move electricity over long distances, integrate renewable generation, and improve grid controllability. Grid investment is therefore becoming increasingly difficult to defer and is being framed as an energy-security requirement rather than a climate objective.
Circularity in Industrials: Eastman
Circularity at its core is about reducing the use of virgin materials. While many of the technologies in the industrials space are early-stage, making them in some cases more expensive, the benefit comes from reducing reliance on volatile input prices driven by external shocks, geopolitics, trade policy, or scarce resources. Eastman is one of the clearest examples of how the higher petrochemical feedstock costs driven by the Iran war are making its recycled materials more economically competitive. For context, Eastman is a global specialty materials company innovating in circular manufacturing by converting hard-to-recycle plastic waste into high-quality recycled materials for a broad range of end markets.
Industry disruptions and rising input costs are pressuring global chemical producers, while Eastman’s largely U.S.-based, integrated operations give it a cost and reliability advantage that supports competitive pricing and potential market-share gains. Additionally, Eastman is benefiting from increased demand for its recycled products. The consumer packaging segment is particularly stressed right now given demand challenges, and as a result is lowering pricing to rebuild volume. Even in this scenario, consumer packaging companies are still buying Eastman’s products, likely because the economics of recycled plastic are favorable to virgin alternatives. Eastman calls out Pepsi and P&G as two key examples of companies holding to their plans of sourcing recycled content during this time. This benefit is emerging as Eastman’s circular business transitions from a large capital project into an operating growth platform. Its first major molecular-recycling facility in Kingsport, Tennessee, is running successfully, with improving yields and reliability. Management now describes the business as capacity constrained rather than demand constrained, indicating that customer interest is already exceeding Eastman’s current ability to supply the market.
Clean Energy: India ReNew Power
As highlighted above, Asia is one of the most dependent regions in the world on energy imports, and renewables have become an important part of their long-term energy security strategy. India, for example, has limited domestic oil and gas reserves and remains highly exposed to fluctuations in global energy prices. At the same time, electricity demand continues to grow. This combination makes renewable generation an increasingly important tool for improving energy security as evidenced by India’s move to increase its target share of electricity generation from cleaner, localized sources of energy (renewables, nuclear) to 60% by 2035.9 We believe ReNew Energy Global, one of India’s largest pure-play renewable energy providers, is well positioned to benefit through its established solar, wind, and energy storage platform, which makes up an estimated 9% share of the market.10
The sector’s recent growth supports this thesis. Renewable installations reached a record 51 gigawatts in fiscal 2026 and represented approximately 90% of recently added power capacity, with solar remaining the largest contributor.11 Demand for battery storage is also accelerating as India seeks to meet power demand outside daylight hours and improve grid reliability as renewable penetration increases. Management has emphasized that supportive policy, domestic manufacturing incentives, and the continued focus on energy security are strengthening the sector’s long-term growth outlook.
Critical Minerals: SQM
As investments in clean energy and electrification pick up, the importance of securing critical mineral supply chains continues to grow. SQM is a major producer of lithium carbonate and lithium hydroxide, with approximately 95% of its lithium sales directed to Asia.12 The timing and magnitude of any direct demand benefit stemming from the current conflict remain uncertain, particularly given the cyclical nature of the lithium market. Nevertheless, we view the current shock as an incremental long-term tailwind for SQM by strengthening the strategic case for electrification and energy storage.
As highlighted above, recent trade data from China are consistent with this trend. Chinese exports of lithium batteries rose 38% in the first half of 2026, including a 50% year-over-year increase in the first quarter.13 Continued growth in Chinese battery production and exports is a positive indicator for SQM’s underlying lithium demand and potential sales volumes over time.
Conclusion
The current energy shock driven by the war in Iran has provided investors with an opportunity to reflect on our positioning and expectations as to the future of resilient energy systems, particularly as we continue to see rising energy demand stemming from the AI infrastructure buildout. However, it is important to emphasize that the current energy shock is just one blip in a multi-year investment cycle, and as we have learned, the path will not be linear.
1. International Energy Agency, Energy and AI, IEA, Paris, 2025, Executive Summary, pp. 13 to 14. https://iea.blob.core.windows.net/assets/de9dea13-b07d-42c5-a398-d1b3ae17d866/EnergyandAI.pdf
2. Ember, China Cleantech Export Data, updated monthly, last updated 5 August 2026. https://ember-energy.org/data/china-cleantech-export-data/
3. BloombergNEF, Renewable Energy Investments Show One Booming Sector, 26 August 2026. https://about.bnef.com/insights/clean-energy/renewable-energy-investments-show-one-booming-sector/
4. European Commission, A more secure and stable energy system, last updated 22 April. https://commission.europa.eu/topics/energy/eu-action-address-energy-crisis/more-secure-and-stable-energy-system_en
5. European Commission, Electrification Action Plan, COM(2026) 595 final, Brussels, 17 July 2026, p. 1. https://build-up.ec.europa.eu/system/files/2026-07/30-2026-14_Communication%20-%20Electrification%20Action%20Plan%20%28COM%202026%20595%29.pdf
6. European Commission. https://eur-lex.europa.eu/legal-content/EN/TXT/HTML/?uri=CELEX:52026DC0595
7. Siemens Energy, Combined Cycle Power Plants. https://www.siemens-energy.com/global/en/home/products-services/product/combined-cycle-power-plants.html
8. Author’s calculation based on U.S. Energy Information Administration, What is the efficiency of different types of power plants? https://www.eia.gov/tools/faqs/faq.php?id=107
9. Government of India, India’s Nationally Determined Contribution for the Period 2031 to 2035, submitted to the United Nations Framework Convention on Climate Change, 24 April 2026. https://unfccc.int/sites/default/files/2026-04/INDIA%20NDC%202031-35.pdf
10. ReNew Energy Global plc, Annual Integrated Report FY 2025-26. https://www.renew.com/annual-integrated-report-2026
11. ReNew Energy Global plc, Q4 FY26 Results Presentation, May 2026, p. 12. https://investor.renew.com/static-files/eae43b61-f397-4b6f-972d-2ee85b2e0b08
12. Sociedad Química y Minera de Chile S.A., Annual Report 2025, Form 20-F, filed with the U.S. Securities and Exchange Commission, 2026.
13. Bloomberg News, China’s Green-Tech Exports Surge on Energy Transition Demand, Bloomberg, 14 July 2026. https://www.bloomberg.com/news/articles/2026-07-14/china-s-green-tech-exports-surge-on-energy-transition-demand
Disclosures
The views expressed are those of the author and Brown Advisory as of the date referenced and are subject to change at any time based on market or other conditions. These views are not intended to be and should not be relied upon as investment advice and are not intended to be a forecast of future events or a guarantee of future results.
Past performance is not a guarantee of future performance, and you may not get back the amount invested.
The information provided in this material is not intended to be and should not be considered to be a recommendation or suggestion to engage in or refrain from a particular course of action or to make or hold a particular investment or pursue a particular investment strategy, including whether or not to buy, sell or hold any of the securities or funds mentioned. It should not be assumed that investments in such securities have been or will be profitable. To the extent that specific securities are mentioned, they have been selected by the author on an objective basis to illustrate views expressed in the commentary and do not represent all of the securities purchased, sold or recommended for advisory clients. This material is intended solely for our clients and prospective clients, is for informational purposes only and is not individually tailored for or directed to any particular client or prospective client.
The information contained herein has been prepared from sources believed reliable but is not guaranteed by us as to its timeliness or accuracy and is not a complete summary or statement of all available data. The information in this document has not been independently reviewed or audited by outside certified public accountants. The information provided is not intended to be a forecast of future events or a guarantee of future results. Past performance is not indicative of future performance.
Sectors are based on the Global Industry Classification Standard (GICS)® classification system. The Global Industry Classification Standard (GICS) was developed by and is the exclusive property of MSCI and Standard & Poor’s. “Global Industry Classification Standard (GICS), “GICS” and “GICS Direct” are service marks of Standard & Poor’s and MSCI. “GICS” is a trademark of MSCI and Standard & Poor’s.
Terms and Definitions:
Margin Accretive: Describes an activity or investment that is expected to increase a company’s profit margin, all else being equal.
Positioning: The way a portfolio is allocated across securities, sectors, regions or other investment exposures.
Pure-Play: A company whose operations are primarily concentrated in a single industry, product category or business activity.
Tailwind: A condition or development that may support a company, industry or market over a given period.
Year-Over-Year: A method of measuring growth that compares a statistic, such as revenue in one time period, with the same time period one year earlier.