
2024 ASSET ALLOCATION VIEWS
Baseline Allocation Model and Long-Term Projections By Asset Class
For many years, we have used a consistent process for communicating and adjusting a baseline asset allocation strategy for portfolio managers to use with clients. The approach involves the creation of a “standard model” (we tend to avoid terms like “standard” or “model” because our client portfolios are highly customized and rarely adhere strictly to any sort of model), based largely on our long-term conviction about each major asset class, and then periodic “tweaking” as needed to capitalize on an undervalued asset class or to trim exposure to an asset class with elevated risk.
The long-term ranges in the tables below and at left express what we consider to be prudent boundaries for each asset class in a typical, long-term-oriented portfolio, given our 10-year outlook for that asset class. (For example, we currently feel that U.S. equities merit an allocation of 25-35% of a typical client’s portfolio.) Key drivers of our thinking are our expectations for baseline 10-year annualized return, maximum likely drawdown risk (expressed as worst likely one-year outcomes over 10-year and 20-year periods) and the alpha opportunity we think we can reasonably achieve from selection of adept managers. We provide these expectations in the tables.
The medium-term targets in the tables express our current guideline for where to position portfolios within each asset class. Intermediate-term adjustments are, appropriately, based on a disciplined look at various intermediate-term market scenarios that may play out in the next two to three years (these scenarios are discussed further in the next section).
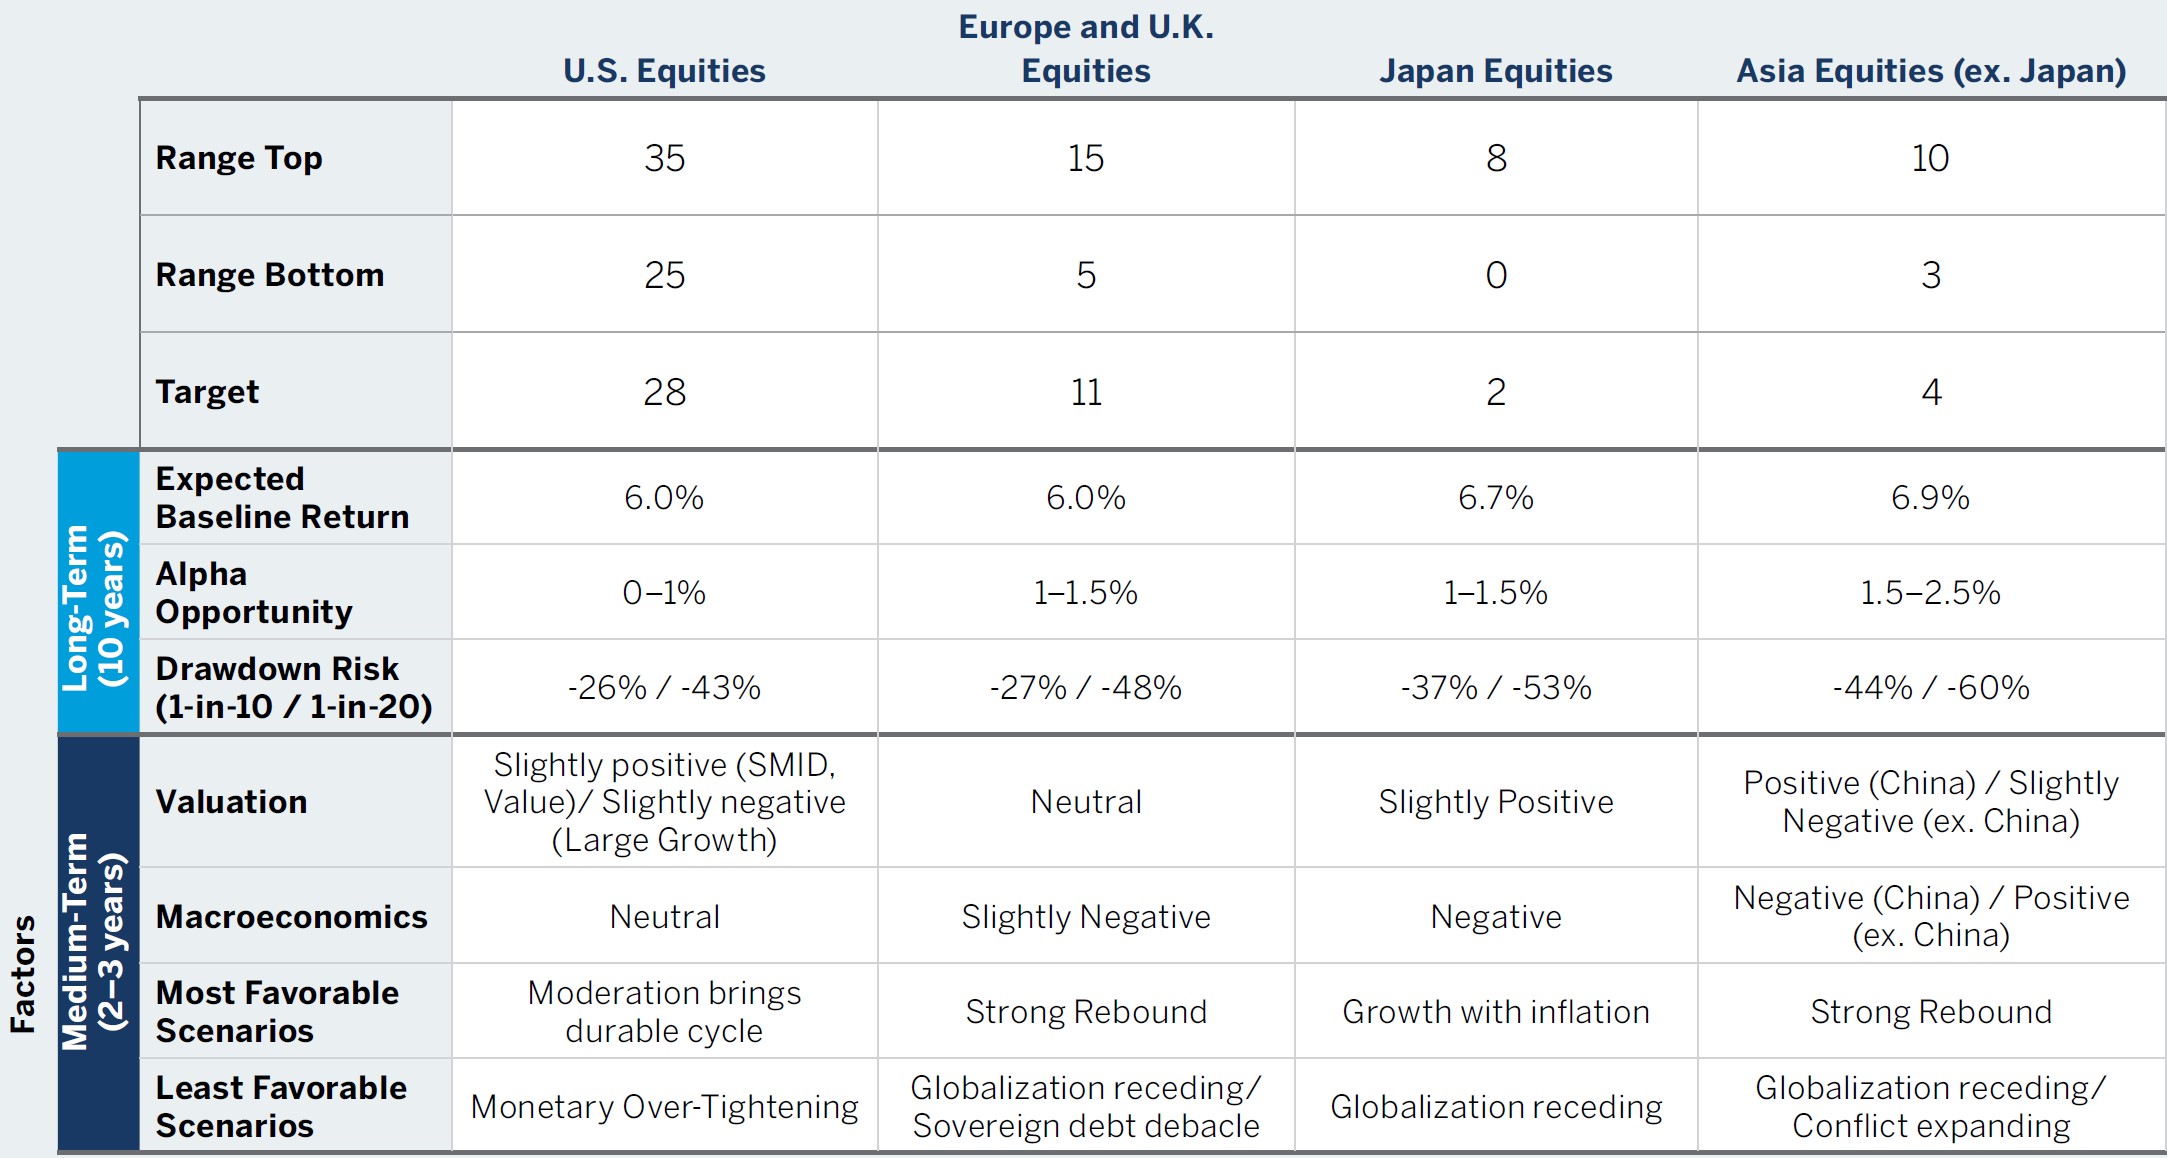
The hypothetical performance depicted in the chart above represents the long-term return estimates. Estimates are calculated using starting valuations and estimates of long-term earnings growth potential and starting level of interest rates. Alpha opportunity is an estimated range measured from an analysis of active managers across each asset class and the hypothetical potential alpha one could achieve through manager selection. Drawdown risk is based on beta-adjusted historical drawdowns of each asset class. The data above is not intended to be a representation of expected returns and should not be relied on in this context. Further information on performance calculations as well as the risks and limitations of investing based on hypothetical returns is available upon request.
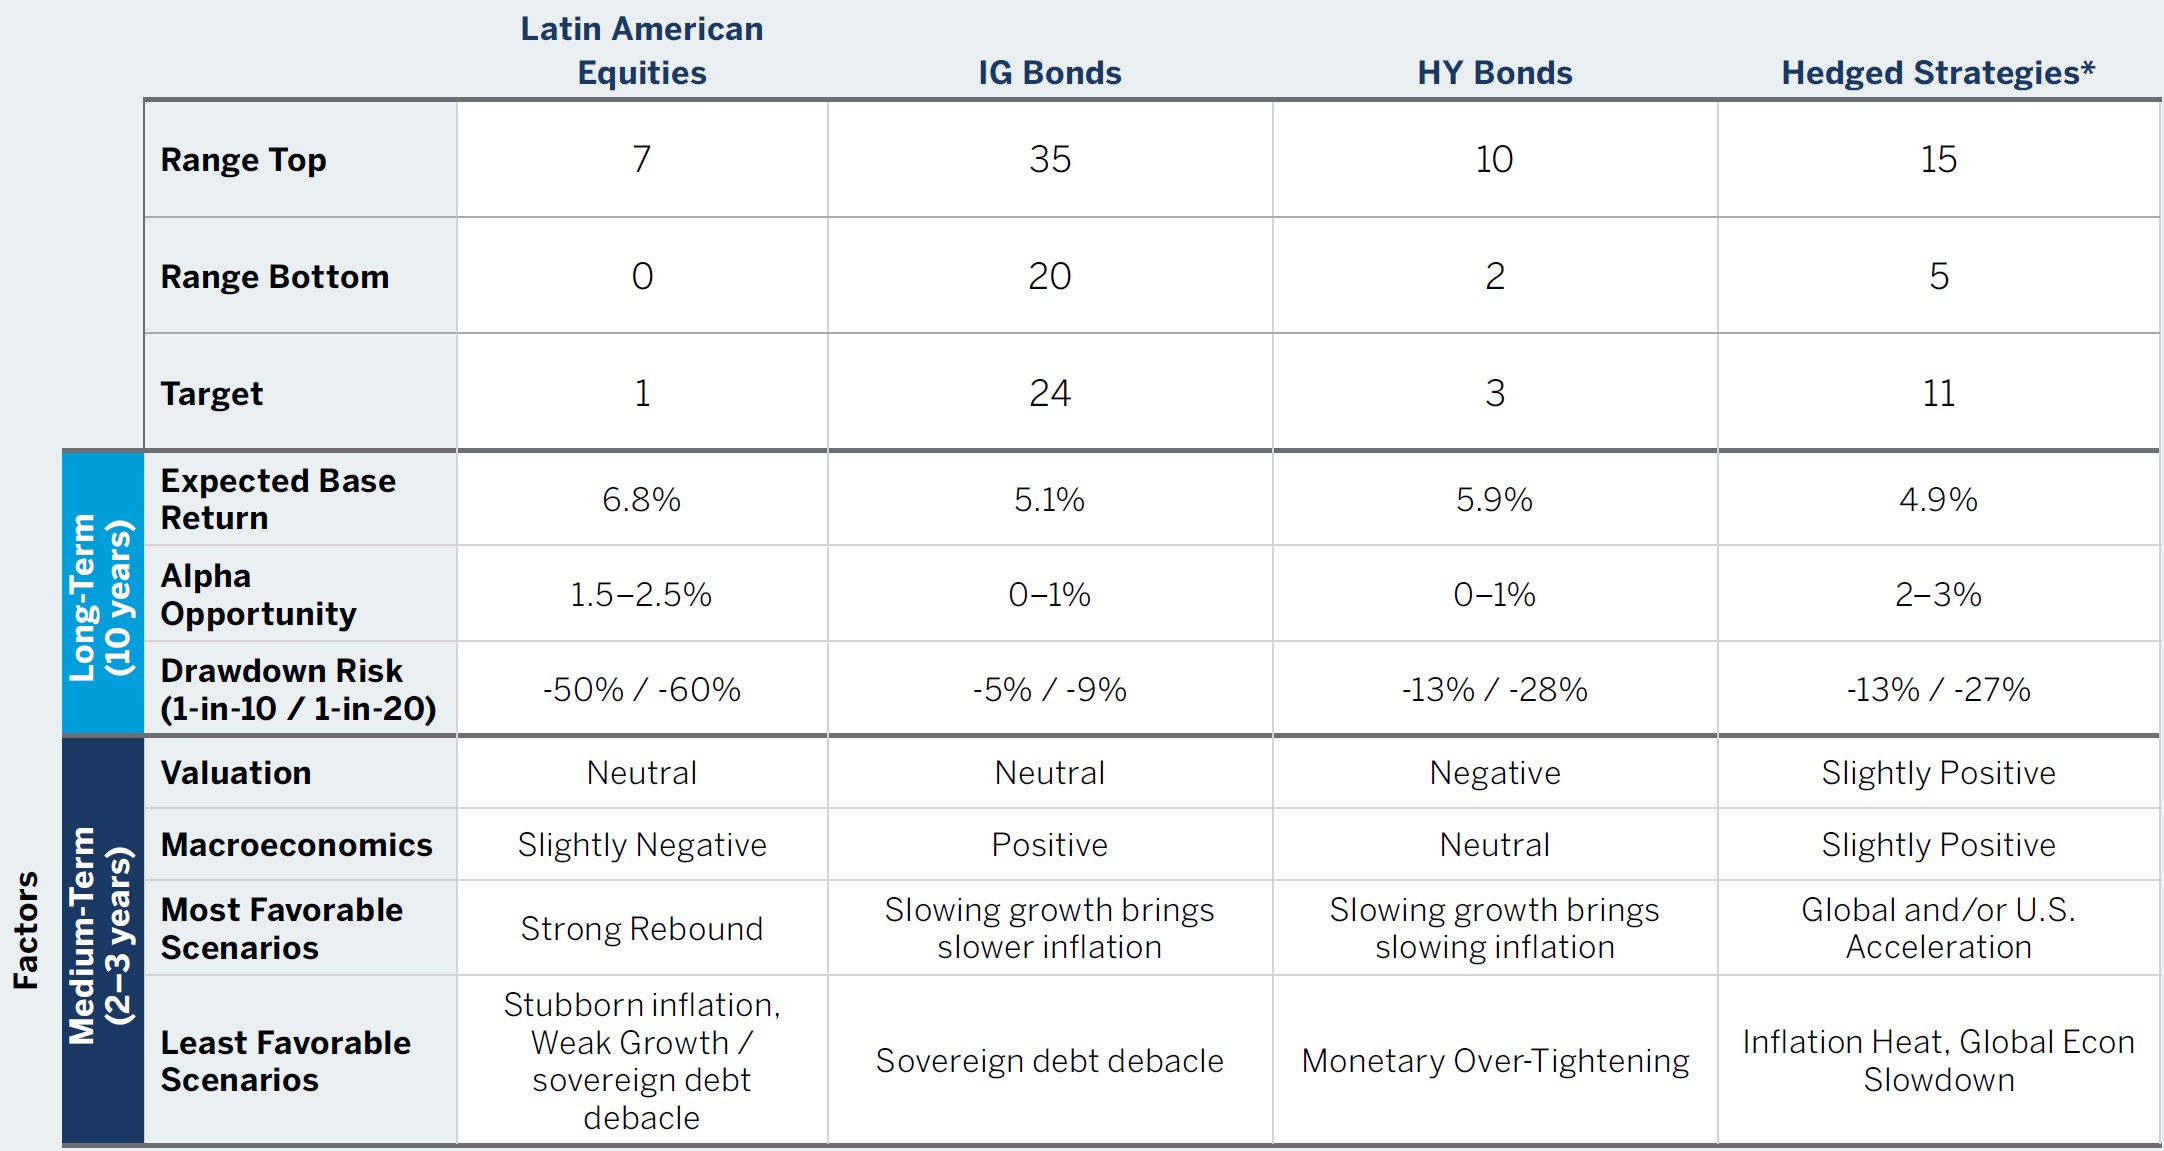
The hypothetical performance depicted in the chart above represents the long-term return estimates. Estimates are calculated using starting valuations and estimates of long-term earnings growth potential and starting level of interest rates. Alpha opportunity is an estimated range measured from an analysis of active managers across each asset class and the hypothetical potential alpha one could achieve through manager selection. Drawdown risk is based on beta-adjusted historical drawdowns of each asset class. The data above is not intended to be a representation of expected returns and should not be relied on in this context. Further information on performance calculations as well as the risks and limitations of investing based on hypothetical returns is available upon request.
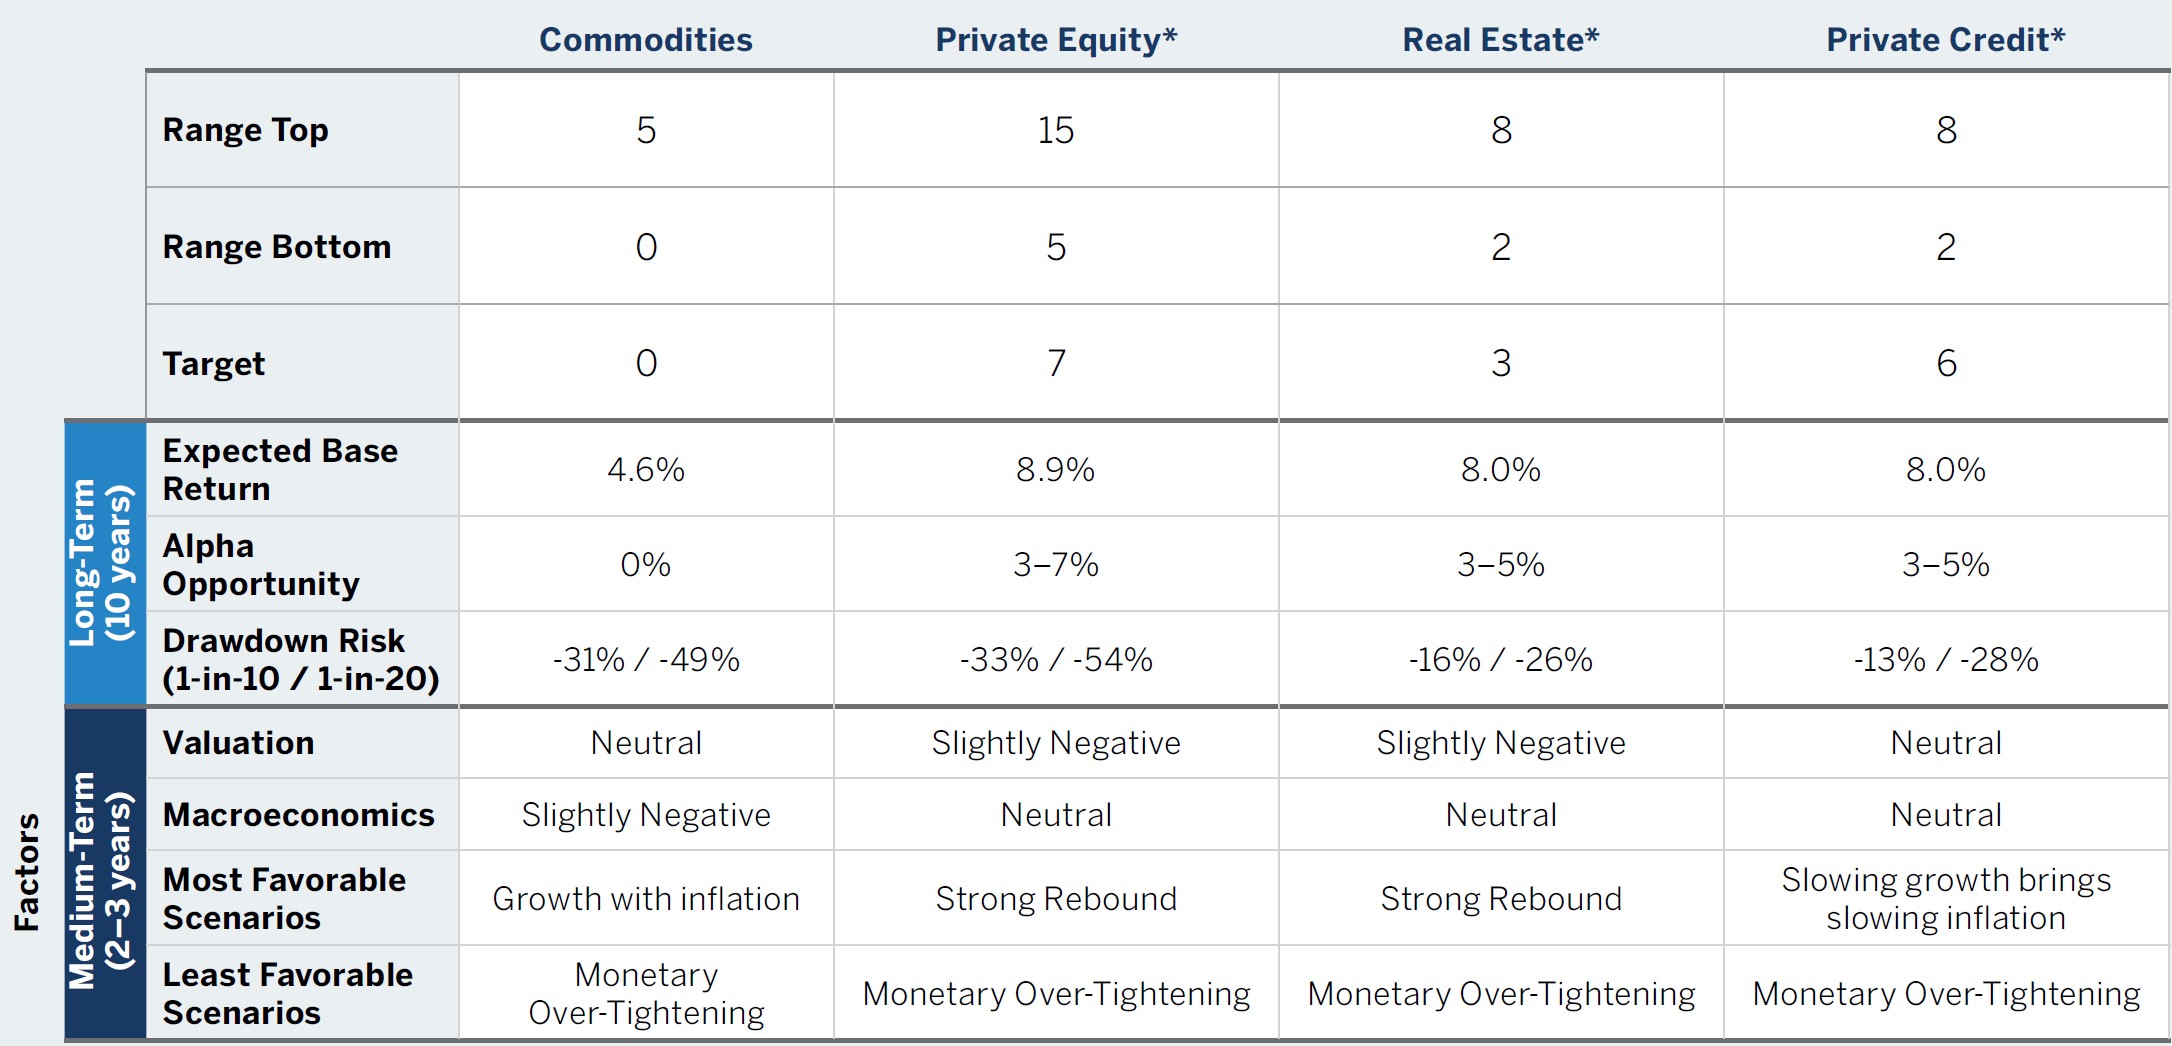
The hypothetical performance depicted in the chart above represents the long-term return estimates. Estimates are calculated using starting valuations and estimates of long-term earnings growth potential and starting level of interest rates. Alpha opportunity is an estimated range measured from an analysis of active managers across each asset class and the hypothetical potential alpha one could achieve through manager selection. Drawdown risk is based on beta-adjusted historical drawdowns of each asset class. The data above is not intended to be a representation of expected returns and should not be relied on in this context. Further information on performance calculations as well as the risks and limitations of investing based on hypothetical returns is available upon request.
Note: All commentary sourced from Brown Advisory as of 12/31/23 unless otherwise noted. Alternative Investments may be available for Qualified Purchasers or Accredited Investors only. Click here for important disclosures, and for a complete list of terms and definitions.