
U.S. FISCAL SITUATION
HIGHLIGHTS
Throughout history, many nations and empires have met their end when they overextended financially, so it is no surprise that sovereign debt has been a key political issue in the U.S. since its founding.
The U.S. responses to the 2008-09 credit crisis, and later the pandemic, required massive fiscal stimulus, such that the U.S.’s debt-to-GDP ratio has risen to levels not seen since WWII.
Investors should monitor several factors—the absolute level of debt, the cost of servicing that debt and the trajectory of debt levels—to assess when (or if) these concerns might begin to influence market returns.
The national debt and the size of the deficit have been a political issue since the Constitution was ratified in 1789. Ronald Reagan famously visualized the debt as a stack of $1,000 bills stacked 67 miles high (when the national debt first passed $1 trillion), and Ross Perot made it the centerpiece of his prominent third-party presidential campaign in 1992.
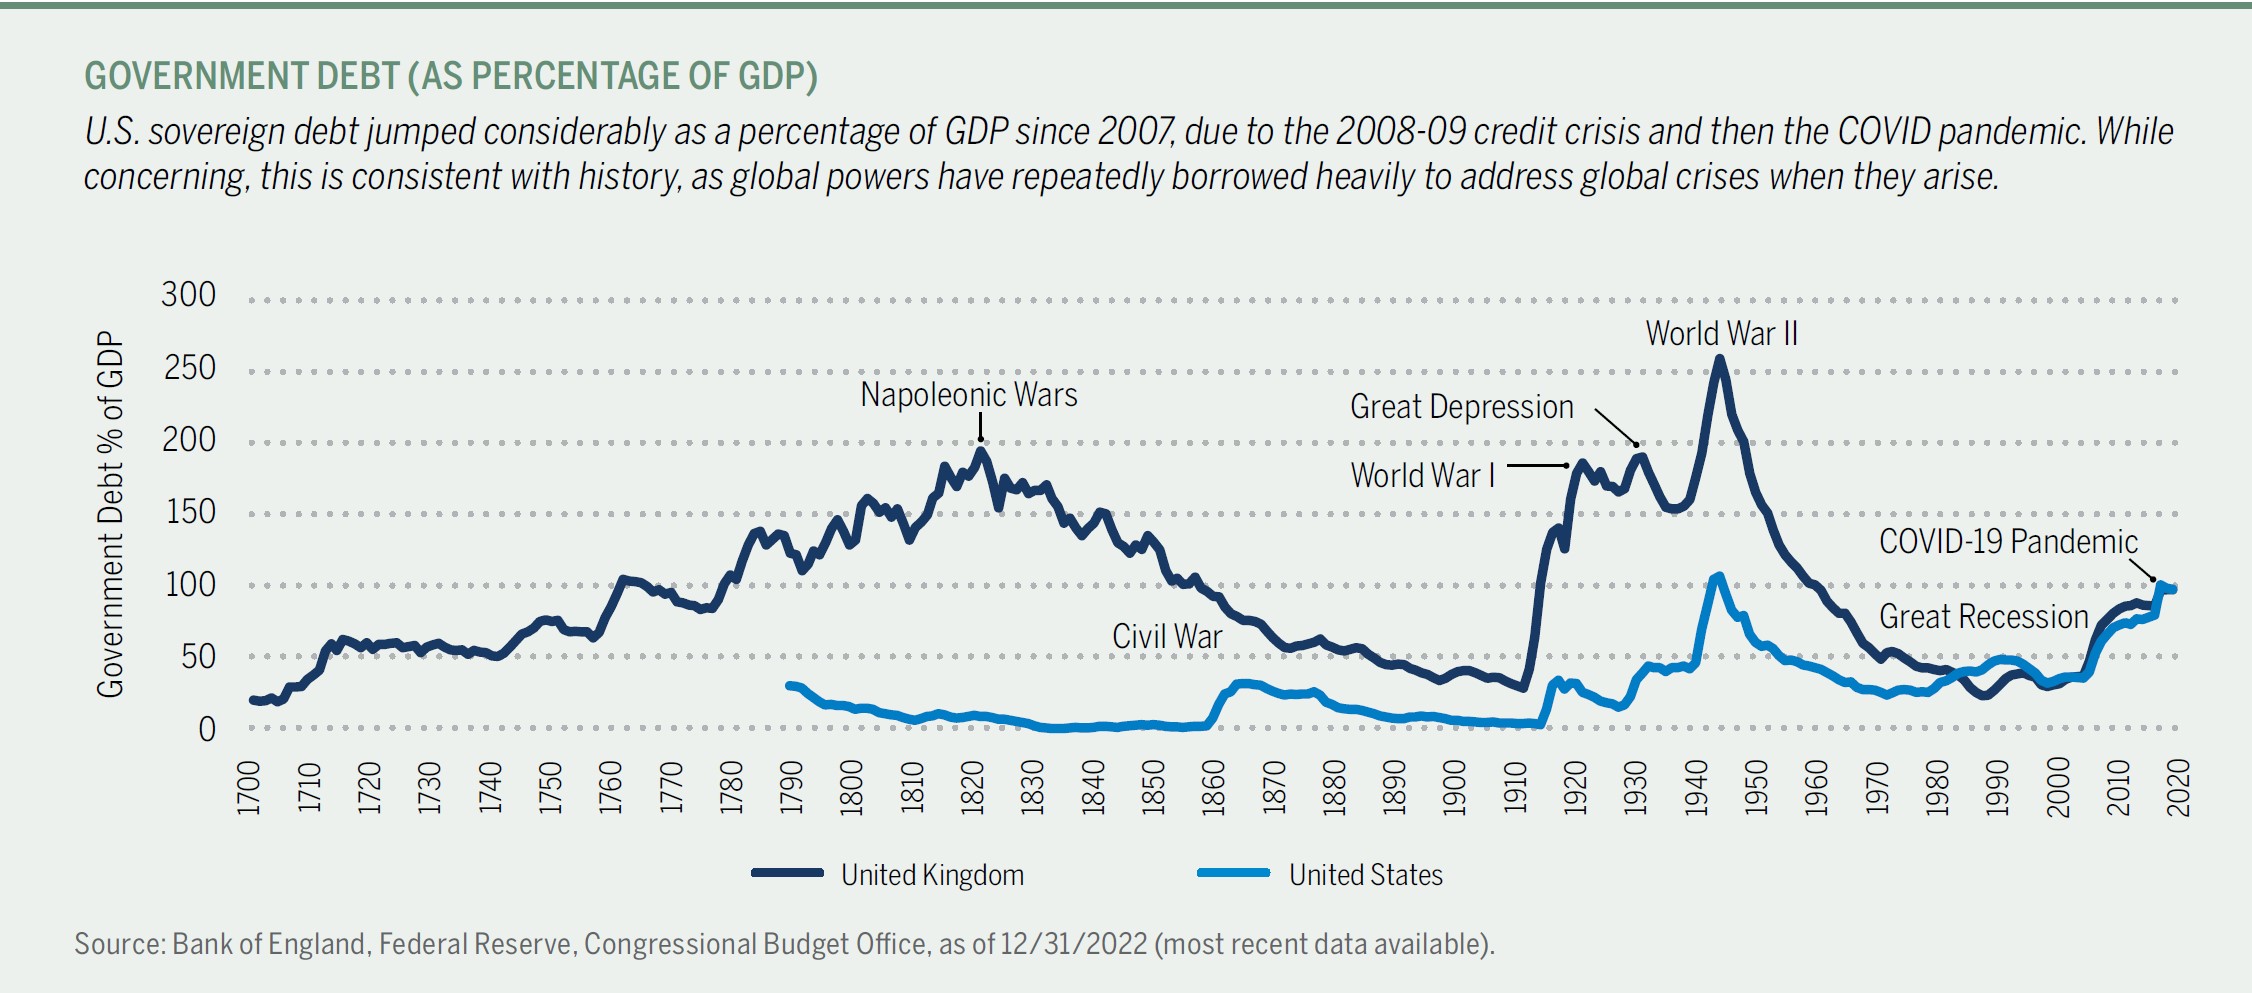
Attention to “debt politics” has been renewed of late, on the heels of the most significant peacetime expansion of government debt in U.S. history. The U.S. countered two major economic disruptions during this period—the 2008-09 credit crisis and the pandemic—with massive fiscal stimulus to stave off dire economic consequences. The plans in both cases “worked,” but today, the U.S. faces a 120% debt-to-GDP ratio, up from 63% in 2007. Until recently, low interest rates and cheap debt allowed the government to largely ignore this problem, but with Treasury yields soaring over the last two years, the Fed is feeling as much of a pinch from higher rates as every other American household.
The problem stems from three factors: the size of the debt, the rising cost of debt service, and the trajectory of deficit spending. None of these are truly at unprecedented levels, but the combination creates a challenging fiscal picture.
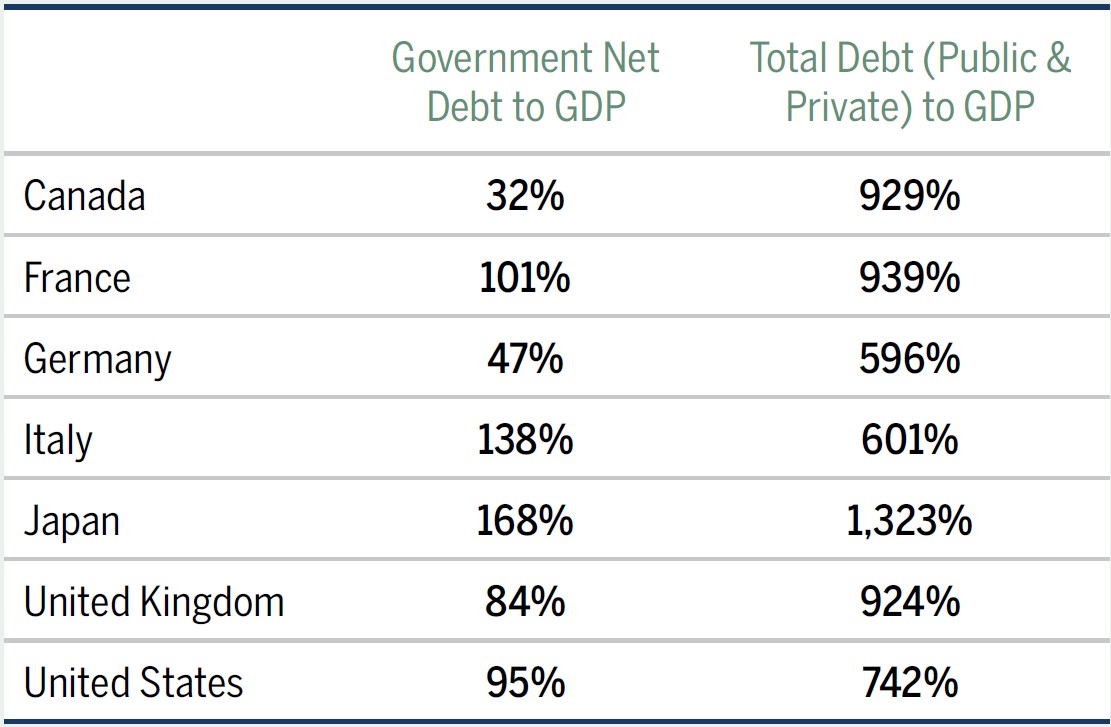
Level of debt: While the “official” level of U.S. public debt is around $32 trillion, the relevant figure is its “net debt” of $26 trillion (this figure excludes loans between Federal entities). This figure is roughly 95% of GDP today (it peaked at 105% just after WWII), as shown in the chart below. This ranks the U.S. in the middle of the G-7 pack (see chart below); Italy and Japan’s comparable ratio has exceeded 100% for decades, and the U.K. peaked at 250% after WWII, so the current scale of U.S. debt does not represent an inevitable crisis.
VOLUME VS. EFFICIENCY
Despite its large absolute debt balances (both net and total), the U.S. is not overly indebted in relation to other developed countries. The relative indebtedness of the U.S. as a percentage of GDP places the U.S. in the middle of the developed-economy pack.
Source: Bloomberg, Brown Advisory analysis.
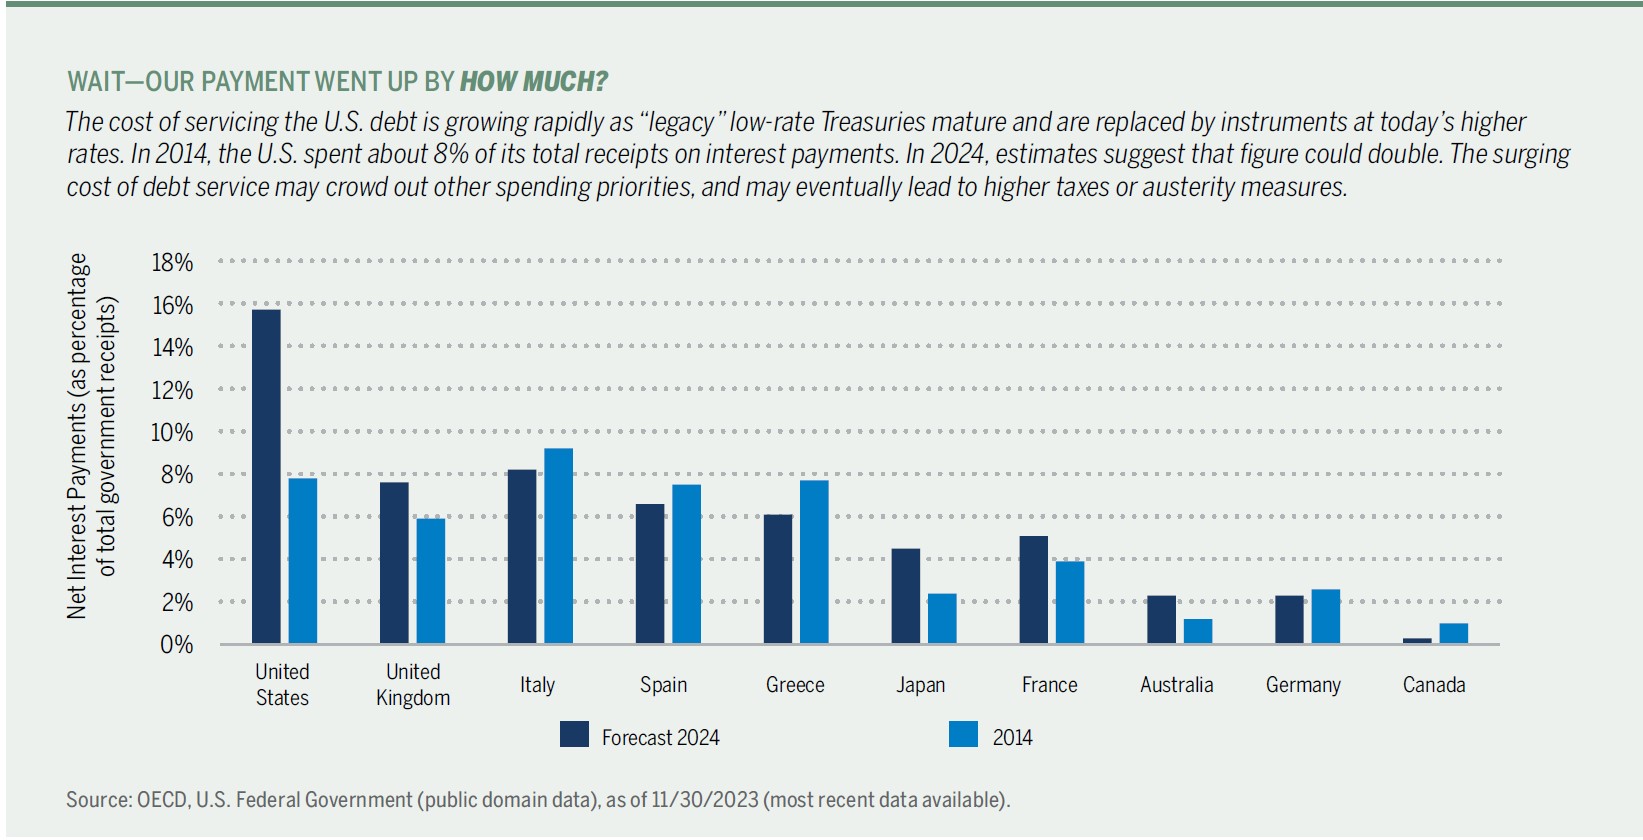
Cost of debt: Despite the aforementioned growth in debt levels, U.S. debt service in 2021 was only 1.5% of GDP, below its post-WWII average, all thanks to low interest rates. However, rising rates have changed all of that for the world’s largest lender. The Congressional Budget Office (CBO) estimates that the government’s net interest expense was $640 billion in 2023, and that this figure has grown by 35% in each of the past two years. It will almost surely continue to grow as the government refinances maturing debt at higher rates; the CBO expects net interest expense to exceed $1 trillion by 2029, and represent 3.2% of GDP, the highest rate on record. The chart below illustrates the extent to which interest payments are growing in the U.S. as a percentage of government receipts, a pattern we are not seeing in other developed economies.
Further, higher debt service costs create pressure to expand deficit spending (see chart below), which complicates any effort to reduce the size of the debt.
Deficit trajectory: The U.S. budget deficit ballooned to 15% of GDP in 2020 as the government rallied to support a locked-down country; the situation improved markedly in the following years, dropping to around 5% of GDP in 2022—still above the post-WWII average of 2%–3% but seemingly on the right track.
But in 2023, tax receipts fell, spending grew, and the deficit jumped up above 6% of GDP again. Worse, the current deficit trajectory appears structural, as opposed to event driven. During the post-WWII era, deficit spending was required by the moment, and after the war ended, both the U.S. and U.K. governments produced budget surpluses for the next decade. But spending today is different; Social Security and Medicare cost the U.S. $2 trillion in 2022, and given the aging demography of the U.S., these programs’ costs are very likely to grow faster than GDP without meaningful reform. Further, interest costs on the debt are likely to grow meaningfully; overall, the scale of interest costs and entitlement spending makes overall spending that much more difficult to curtail and puts ever-greater pressure on other parts of the budget.
In sum, the combination of debt scale, debt cost and deficit trajectory may not produce an imminent crisis, but it suggests that a crisis is inevitable if these factors aren’t managed more effectively going forward.
Addressing the Elephant in the Room
The consequences of excessive debt cannot be avoided forever. Even if there is no storm on the immediate horizon, the U.S. economy is already paying a burden for the government’s debt, in the form of cash outflows to international holders of Treasury bonds, the potential dampening of private investment activity if the government’s borrowing is sopping up too much market demand from investors, and finally in the form of higher interest rates (which are boosted by the government’s insatiable appetite for capital). Overall, high debt levels can create a challenging feedback loop where low economic growth leads to weak government receipts (from income taxes and such), which leads to higher deficits and yet more debt, which further increases pressure on economic growth. Italy and Japan have been trapped in such feedback loops for decades; the U.S. needs to address the situation before something similar happens to it.
There are three primary ways for countries to trim debt:
- Economic growth: The most “pleasant” path to reducing debt levels is to “grow beyond them.” The last time the U.S.’s debt-to-GDP ratio fell notably was in the 1990s, when the tech boom and dot-com rush ushered in multiple years of high tax receipts, budget surpluses and a rapidly growing GDP in relation to debt. The challenge is that “rapid economic growth” is not a policy option; governments can try to facilitate growth, but in the end, game-changing growth cycles emerge from innovation and ideas, not from policy tweaks.
- Austerity: European policymakers imposed this belt-tightening strategy on highly indebted countries like Greece and Italy (to various extents) when dealing with Europe’s debt crisis a decade ago. While fairly straightforward in addressing the issue, this solution is politically unattractive to most policymakers; the backdrop of the 2008-09 credit crisis empowered this approach from the EU, but in many “normal” situations, austerity would nearly ensure defeat in the next election. Austerity also must be balanced with economic considerations, as it generally produces a drag on economic growth.
- Inflation: This path is the equivalent of writing down one’s debt valuation; since government debt is in nominal dollars (aside from TIPS), inflation would reduce the effective debt load relative to future GDP totals. In theory, an inflation rate of 3%–4% would stoke at least nominal GDP growth, which would have many of the same benefits discussed under economic growth.
Historically, governments have turned to this option, but coordinating monetary and fiscal policy to this end can ruin the public’s confidence in a central bank, and playing with inflation is akin to playing with economic fire (Argentina and Turkey are good recent cautionary tales, with inflation exceeding 100% in both countries for a time).
None of these three “solutions” are straightforward to execute, but as the debt rises higher, the need for dramatic action rises as well. The market may eventually force policymakers to take swift action, which can be very painful—unfortunately, governments rarely take painful proactive steps in these situations. The Eurozone crisis of 2011 is a great example; Italy’s debt situation hadn’t changed meaningfully in many years, but in 2011, a scare around Eurozone government debts, centered on Greece, led to a spike in Italian government bond yields. Seemingly overnight, the market was demanding structural change in Italy before funding new bonds, so the government had to raise taxes and reduce spending at a time when its economy was floundering. We believe the U.S. should act now to avoid pain later, but the current state of congressional politics does not offer much hope for meaningful action—especially when there is no immediate crisis to force Congress to act.
Unchecked debt levels will inevitably put pressure on interest rates, economic growth and, ultimately, on returns generated by financial markets. That impact is hard to see or feel; it is usually overwhelmed on a year-to-year basis by cyclical factors, but it is always there, nonetheless. Debt and deficit issues in the U.S. have contributed to our broadly cautious long-term outlook for equity returns and have influenced our decision to be more conservatively positioned in today’s environment.
Note: All commentary sourced from Brown Advisory as of 12/31/23 unless otherwise noted. Alternative Investments may be available for Qualified Purchasers or Accredited Investors only. Click here for important disclosures, and for a complete list of terms and definitions.