
Fast Reading
- Small- and mid-cap benchmarks, alongside their large-cap peers, are undergoing unusually large changes in sector exposure, market capitalization profile and index composition.
- Several Russell small and mid-cap indices are expected to experience dramatic overnight sector shifts, particularly within Russell Midcap® Growth, Russell 2000® Growth and Russell 2000® Value Indexes.
- Beginning in 2026, Russell U.S. Indexes are moving from an annual to a semi-annual reconstitution schedule, with a second size-focused reconstitution in December designed to reduce capitalization drift.
- In our view, these changes reinforce a broader point: investors should apply further scrutiny to understand what they own.
Introduction
The 2026 Russell reconstitution illustrates how quickly benchmark exposures can evolve. Headlines are focused on large-caps, with significant changes to Magnificent 71 style classification and new IPO exceptions being made for mega-cap IPOs.2 However, we see similar dynamics that have been occurring in small and mid-cap benchmarks for some time, and the impact of this year’s reconstitution is even greater at the bottom of the market cap spectrum.
The 2026 FTSE Russell reconstitution is expected to create unusually large changes across the small and mid-cap universe. Sector weights are shifting, market capitalization profiles are falling sharply, and large winners are moving out of small-cap benchmarks. Additionally, Russell is changing the frequency of reconstitution itself, moving from an annual process to a semi-annual schedule beginning in 2026. According to Russell, the change is intended to maintain more accurate market representation as market conditions, valuations and dispersion change continuously.
These developments matter because the Russell U.S. indexes are widely used for asset allocation, performance measurement and index-linked products. FTSE Russell has noted that approximately $12.2 trillion in investor assets are benchmarked to or invested in products based on the Russell U.S. Indexes.3 When those benchmarks change, the effects can extend far beyond index construction and can have a real impact on investor portfolios.
A Record Reset in Small
While it is not unusual to see meaningful changes during the annual reconstitution, particularly in smaller-cap growth indices, this year’s changes appear unusually dramatic.
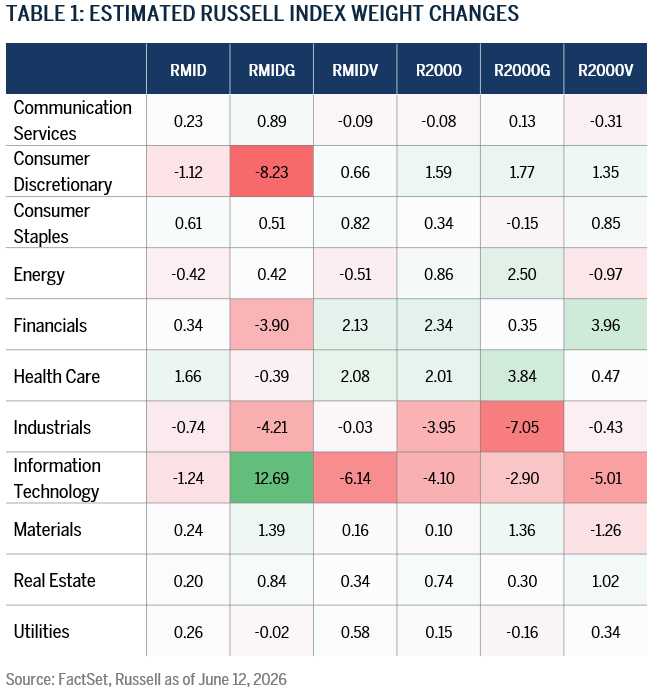
Based on estimated index weight changes as of June 12, 2026 as set out in the chart below, several sector moves stand out. Within small caps, the Russell 2000 Growth Index is expected to see Industrials fall by approximately 7.1%, while Health Care rises by roughly 3.8% and Energy rises by 2.5%. The Russell 2000 Value Index is expected to see Financials increase by roughly 4.0% while Information Technology declines by approximately 5.0%. Further meaningful changes are highlighted in the chart below.
These are not marginal adjustments. For passive investors in particular, they represent meaningful changes in underlying exposure that will occur overnight at the end of June. A portfolio that looked like one expression of small cap growth or mid cap value before reconstitution will look quite different afterward.
In our view, this is one of the most important implications of the 2026 reconstitution. Benchmarks – and in many ways asset class labels – remain unchanged, while the underlying exposures, constituents and composition are set to shift significantly.
Why Are the Changes So Large?
While this year’s changes are dramatic, they are not surprising given the level of concentration that has developed within small and mid-cap benchmarks.
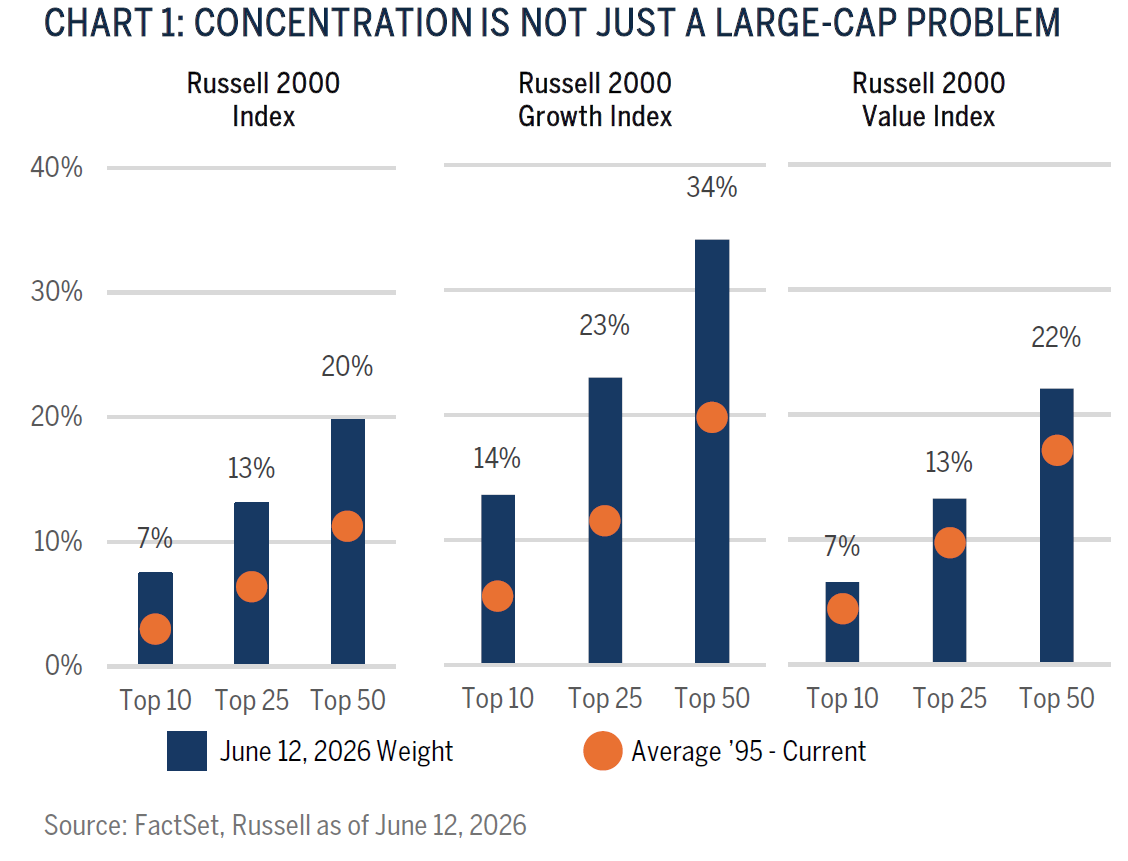
The Russell 2000® Index may appear a broadly diversified index because it contains roughly 2000 securities. But market capitalization weighting means the largest stocks still matter a great deal. As the winners keep winning, they can become increasingly influential, not quite as extreme as the Magnificent 7 in large-cap land, but as shown in the chart below, the top 50 companies represent over a third of the Russell 2000 Growth Index. It’s fair to say concentration across Russell indices is well above historical norms.
This concentration also affects the mechanics of reconstitution. Historically, the average weight of deletions, or names leaving the Russell 2000® Index, has been approximately 11.3% of the Index. This year, the estimated deletion weight steps up to just over 17%, close to the Index’s all-time high in 2003 when it was 18.8%. By contrast, the estimated additions represent approximately 5.7% of the Index, which is slightly smaller than the last several years and well below the average.4
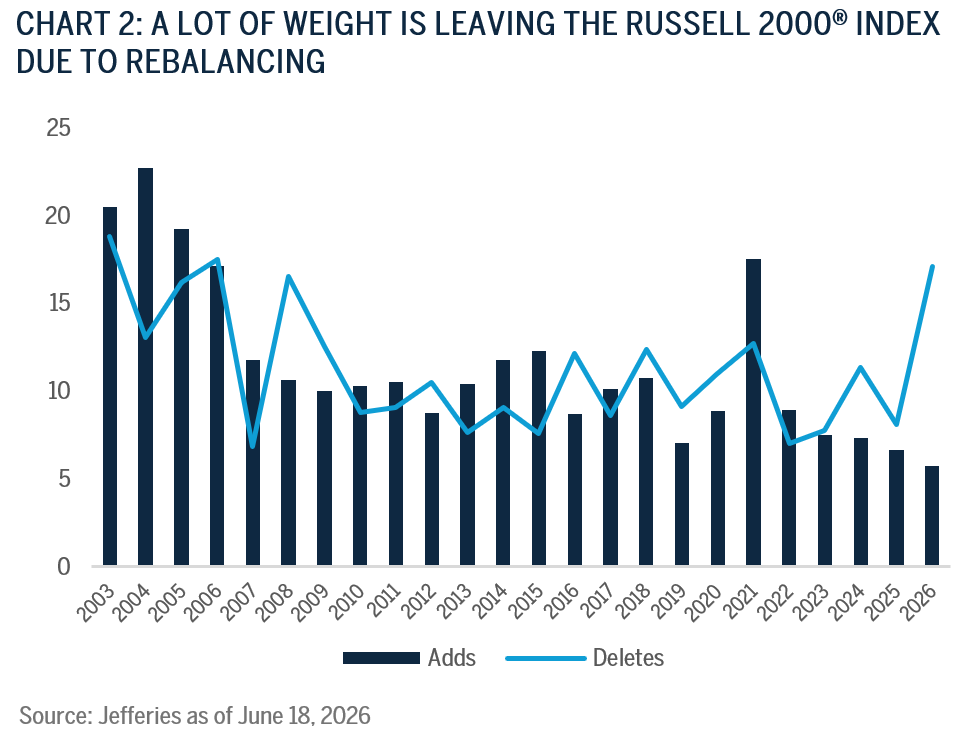
This has broader implications for portfolio turnover, trading activity, liquidity management and benchmark comparability. Higher turnover generally requires more buying and selling by index-tracking funds, potentially increasing trading volumes and transaction costs around reconstitution. The unusually large amount of weight leaving the Index may also create temporary liquidity pressures in affected securities.
When Small Cap Stops Looking Small
In recent years, in concert with the aforementioned concentration, several companies have appreciated so significantly that while remaining in the Russell 2000 Index, they look increasingly unlike traditional small-cap companies. This leaves active managers with an uncomfortable choice: own companies that may no longer fit their small-cap investment philosophy, or risk underperforming a benchmark being driven by stocks that have outgrown the category.
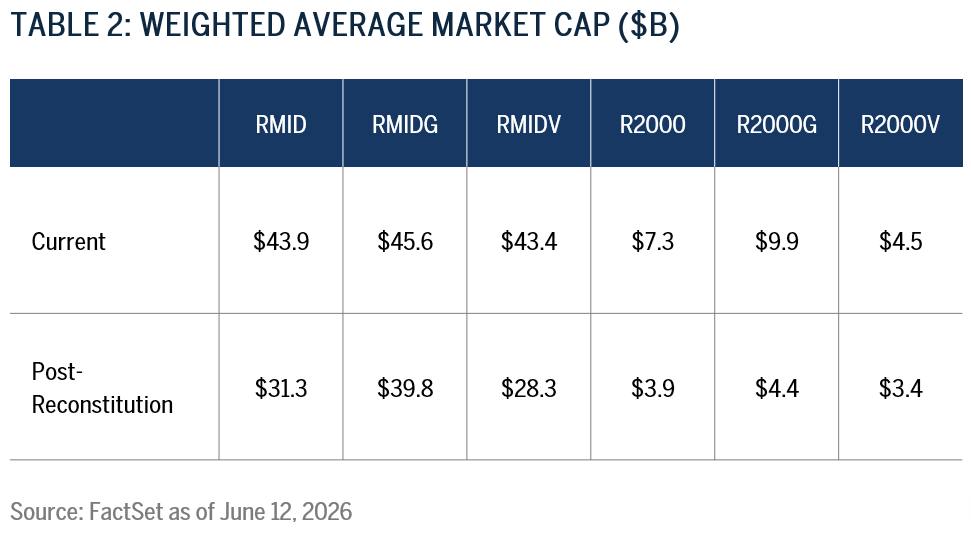
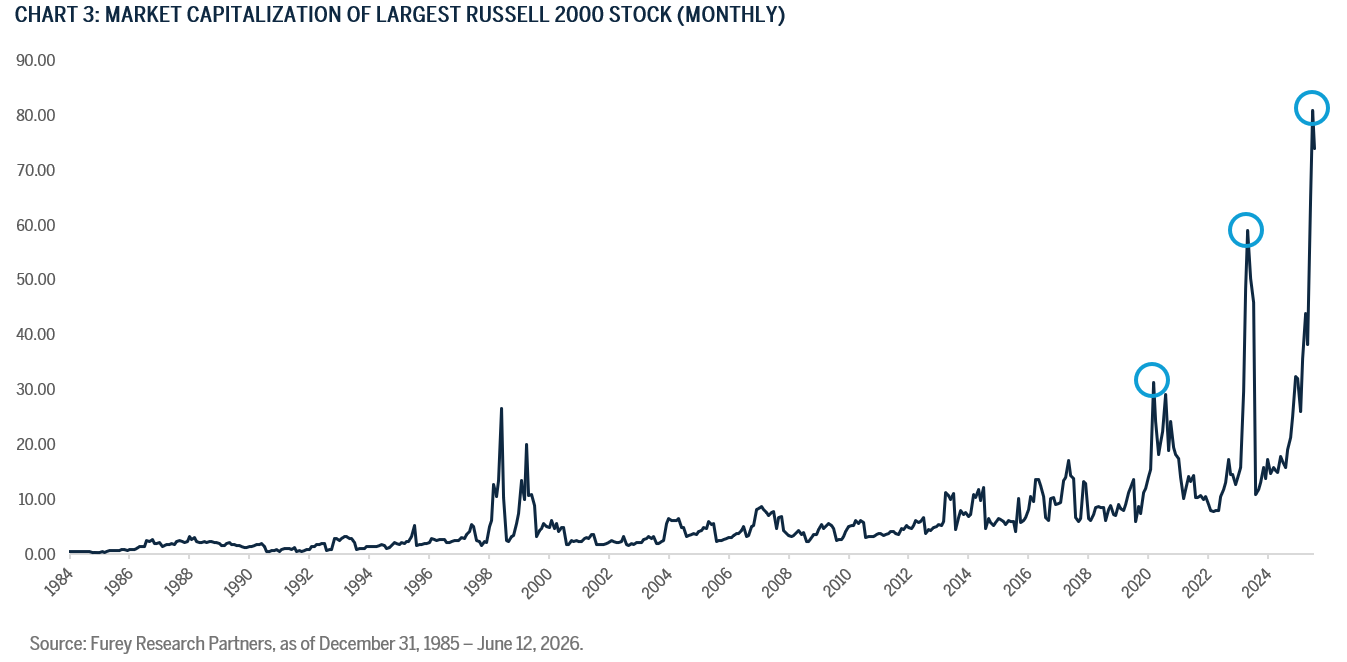
Perhaps the clearest evidence of benchmark drift is the expected change in market capitalization profile. Following reconstitution, the maximum market capitalization in the Russell Midcap Index is expected to fall from approximately $293 billion to $83 billion. In the Russell 2000 Index, the maximum market capitalization is expected to fall from approximately $74 billion to $13 billion. Weighted average market capitalizations are also expected to decline meaningfully: from $43.9 billion to $31.3 billion in the Russell Midcap Index, and from $7.3 billion to $3.9 billion in the Russell 2000 Index.
It is normal for market capitalization levels to decline during reconstitution – it is partly the point of the process – so that companies that have become too large graduate from the Russell 2000 indices, while smaller companies enter or remain in the appropriate benchmark. What is unusual this year is the magnitude. Notably, for the first time ever, a company will graduate from the Russell 2000 Index directly into the Russell Top 200 Index, a striking signal that these indices may provide exposures that differ meaningfully from what some investors expect based solely on their names – a problem Russell hopes to solve with the introduction of a twice annual reconstitution.
Twice Annual Reconstitution
Beginning this year, Russell U.S. Indexes are moving from annual to semi-annual reconstitution, with the June reconstitution supplemented with a second reconstitution that is expected to occur in December. The December event should assign companies across indices based on their market capitalization ranking on the last business day in October. However, the December style index changes are expected to be limited to new additions or membership movements, while full growth and value style rebalancing should occur annually in June.
In practical terms, this should reduce the amount of time that a rapidly appreciating company can remain in the wrong size bucket. That may improve benchmark representation and reduce some of the extreme bloat that has affected small cap benchmarks in recent years. The volatility, dispersion and growth in benchmarked assets have increased the need for a more responsive process.
However, it also introduces new trade-offs. Investors will now face two major Russell events each year. Index-linked portfolios may need to manage more frequent turnover, liquidity requirements and tracking-error risk. For active managers, the effect cuts both ways. A more frequent size reset may reduce the pressure to own companies that no longer fit a small cap discipline. On the other hand, it may also remove the opportunity to benefit from avoiding highly speculative benchmark constituents if those companies graduate before their share prices normalize.
Time will tell whether the new framework helps or hurts relative performance, but conceptually, it is difficult to argue that large-cap companies should remain in small-cap indices simply because the calendar has not yet caught up.
Know What You Own
Beyond size, non-earners remain an important issue across small cap indices, and the percentage of unprofitable companies is expected to increase after the reconstitution. We believe this matters because benchmark composition is not just about sector weights or market capitalization, it is also about business quality.
Small-cap benchmarks contain meaningful exposure to businesses with negative earnings, weak balance sheets or limited self-funding capacity. That does not make the benchmark wrong. But it does mean investors should understand the exposure they are accepting. This is particularly important after periods when speculative or low-quality companies have performed well. Market capitalization weighting rewards price appreciation regardless of the durability of the underlying business model. If a company’s stock price rises sharply, its benchmark weight rises as well. An index does not ask whether the business is profitable, whether the balance sheet can support growth, or whether cash generation is improving.
That distinction is central to active management in small- and mid-caps. The opportunity set is broad, inefficient, often under-researched, and sometimes misunderstood. But it also contains a wide range of business quality. Some companies have durable business models and attractive reinvestment opportunities. Others are highly cyclical, financially fragile or dependent on external capital.
In our view, the 2026 reconstitution reinforces the importance of knowing what you own. An investor buying an index-linked product like the Russell 2000 Growth, Russell 2000 Value or Russell Midcap Growth Index is not simply buying a label. They are buying a specific combination of companies spanning different sectors, market capitalization exposures, profitability characteristics and index methodology decisions.
Why This Matters
Many investors continue to think of passive benchmarks as neutral representations of the market, but we believe that assumption deserves closer scrutiny. Benchmarks are rules-based, but the rules themselves are designed, reviewed and modified by benchmark providers. Decisions about reconstitution frequency, style assignment and eligibility criteria all shape the exposures investors ultimately receive. That does not necessarily mean benchmarks are flawed. It means they are constructed. And because they are constructed, their methodology matters.
At Brown Advisory, our investment philosophy remains unchanged. We continue to believe durable long-term investment outcomes are driven by business model quality, management execution, capital allocation discipline, balance sheet strength and the ability of companies to compound value over time. Reconstitution may create opportunities. It may also create risks. But our investment decisions are not driven by benchmark mechanics alone. They are driven by our assessment of the underlying businesses.
Conclusion
Benchmarks were originally designed to measure markets. Increasingly, however, benchmark providers are making decisions that influence how those markets are represented.
The 2026 Russell reconstitution is a clear example. Sector exposures are shifting materially. Market capitalization profiles are resetting sharply. Concentration is being reduced. Non-earner exposure remains a key factor. And the move to semi-annual adjustments changes the rhythm of benchmark reconstitution itself.
For investors, the takeaway is straightforward. The name of the benchmark may not change, but the exposures it provides you will. In a year like 2026, that distinction matters.
- The Magnificent 7 companies are: Alphabet (Google), Amazon, Apple, Meta (Facebook/Instagram), Microsoft, Nvidia and Tesla.
- You can read more about the Russell reconstitution for large-caps in our article: https://www.brownadvisory.com/us/insights/great-benchmark-reset
- Source: Russell as of May 22, 2026 https://www.lseg.com/en/media-centre/press-releases/ftse-russell/2026/f…
- Source: Addition and deletion weight data from Jefferies as of June 18, 2026.
Disclosures
The views expressed are those of the author and Brown Advisory as of the date referenced and are subject to change at any time based on market or other conditions. These views are not intended to be and should not be relied upon as investment advice and are not intended to be a forecast of future events or a guarantee of future results.
Past performance is not a guarantee of future performance, and you may not get back the amount invested.
The information provided in this material is not intended to be and should not be considered to be a recommendation or suggestion to engage in or refrain from a particular course of action or to make or hold a particular investment or pursue a particular investment strategy, including whether or not to buy, sell or hold any of the securities or funds mentioned. It should not be assumed that investments in such securities have been or will be profitable. To the extent that specific securities are mentioned, they have been selected by the author on an objective basis to illustrate views expressed in the commentary and do not represent all of the securities purchased, sold or recommended for advisory clients. This material is intended solely for our clients and prospective clients, is for informational purposes only and is not individually tailored for or directed to any particular client or prospective client.
The information contained herein has been prepared from sources believed reliable but is not guaranteed by us as to its timeliness or accuracy and is not a complete summary or statement of all available data. The information in this document has not been independently reviewed or audited by outside certified public accountants. The information provided is not intended to be a forecast of future events or a guarantee of future results. Past performance is not indicative of future performance.
Terms and Definitions
Market Capitalization refers to the aggregate value of a company’s publicly traded stock. Statistics are calculated as follows: Weighted Average, the average of each holding’s market cap, weighted by its relative position size in the portfolio; Weighted Median, the value at which half the portfolio’s market capitalization weight falls above and half falls below; Maximum and Minimum, the market caps of the largest and smallest companies, respectively, in the portfolio.
FactSet® is a registered trademark of FactSet Research Systems, Inc.
Sectors are based on the Global Industry Classification Standard (GICS) classification system. The Global Industry Classification Standard (GICS) was developed by and is the exclusive property of MSCI and Standard & Poor’s. “Global Industry Classification Standard (GICS), “GICS” and “GICS Direct” are service marks of Standard & Poor’s and MSCI . “GICS” is a trademark of MSCI and Standard & Poor’s.
An investor cannot invest directly into an index. Benchmark returns are not covered by the report of the independent verifiers.
The Russell 2000® Index (R2000) measures the performance of the small-cap segment of the U.S. equity universe. The Russell 2000 is a subset of the Russell 3000® Index representing approximately 10% of the total market capitalization of that index. It includes approximately 2000 of the smallest securities based on a combination of their market cap and current index membership.
The Russell 2000® Value Index (R2000V) measures the performance of the small-cap value segment of the U.S. equity universe. It includes those Russell 2000® Index companies with lower price-to-book ratios and lower forecasted growth values.
The Russell 2000® Growth Index (R2000G) measures the performance of the small-cap growth segment of the U.S. equity universe. It includes those Russell 2000® Index companies with higher price-to-book ratios and higher forecasted growth values.
The Russell MidCap® Growth Index (RMIDG) is a market capitalization weighted index representing the smallest 800 companies in the Russell 1000 Index that exhibit growth characteristics.
The Russell MidCap® Value Index (RMIDV) is a market capitalization weighted index representing the smallest 800 companies in the Russell 1000 Index that exhibit value characteristics.
The Russell Top 200® Index measures the performance of the largest cap segment of the US equity universe. The Russell Top 200 Index is a subset of the Russell 3000® Index. It includes approximately 200 of the largest securities based on a combination of their market cap and current index membership and represents approximately 68% of the Russell 3000® Index, as of the most recent reconstitution.