
At sunrise, sleepy students with oversized backpacks congregate at neighborhood corners. Large, yellow buses with swing-out stop signs saturate and extend the morning commute. A cacophony of deep coughs, sniffles and sneezes permeate classrooms and homes. With these dreary alliterations, summer freedom gives way to the inevitable start-of-school routine.
In recent years, it’s become similarly routine for the Russell 1000® Growth Index to substantially outperform other broad domestic indices. Thus far, 2025 is no different from 2023 nor 2024 in that respect. Since OpenAI launched ChatGPT on November 30, 2022, the Russell 1000 Growth Index has compounded at a sizzling 29% annually, while only one-third of its constituents have outperformed the benchmark. To be sure, historically speaking this highly concentrated, high-octane large-cap growth market is anything but routine!
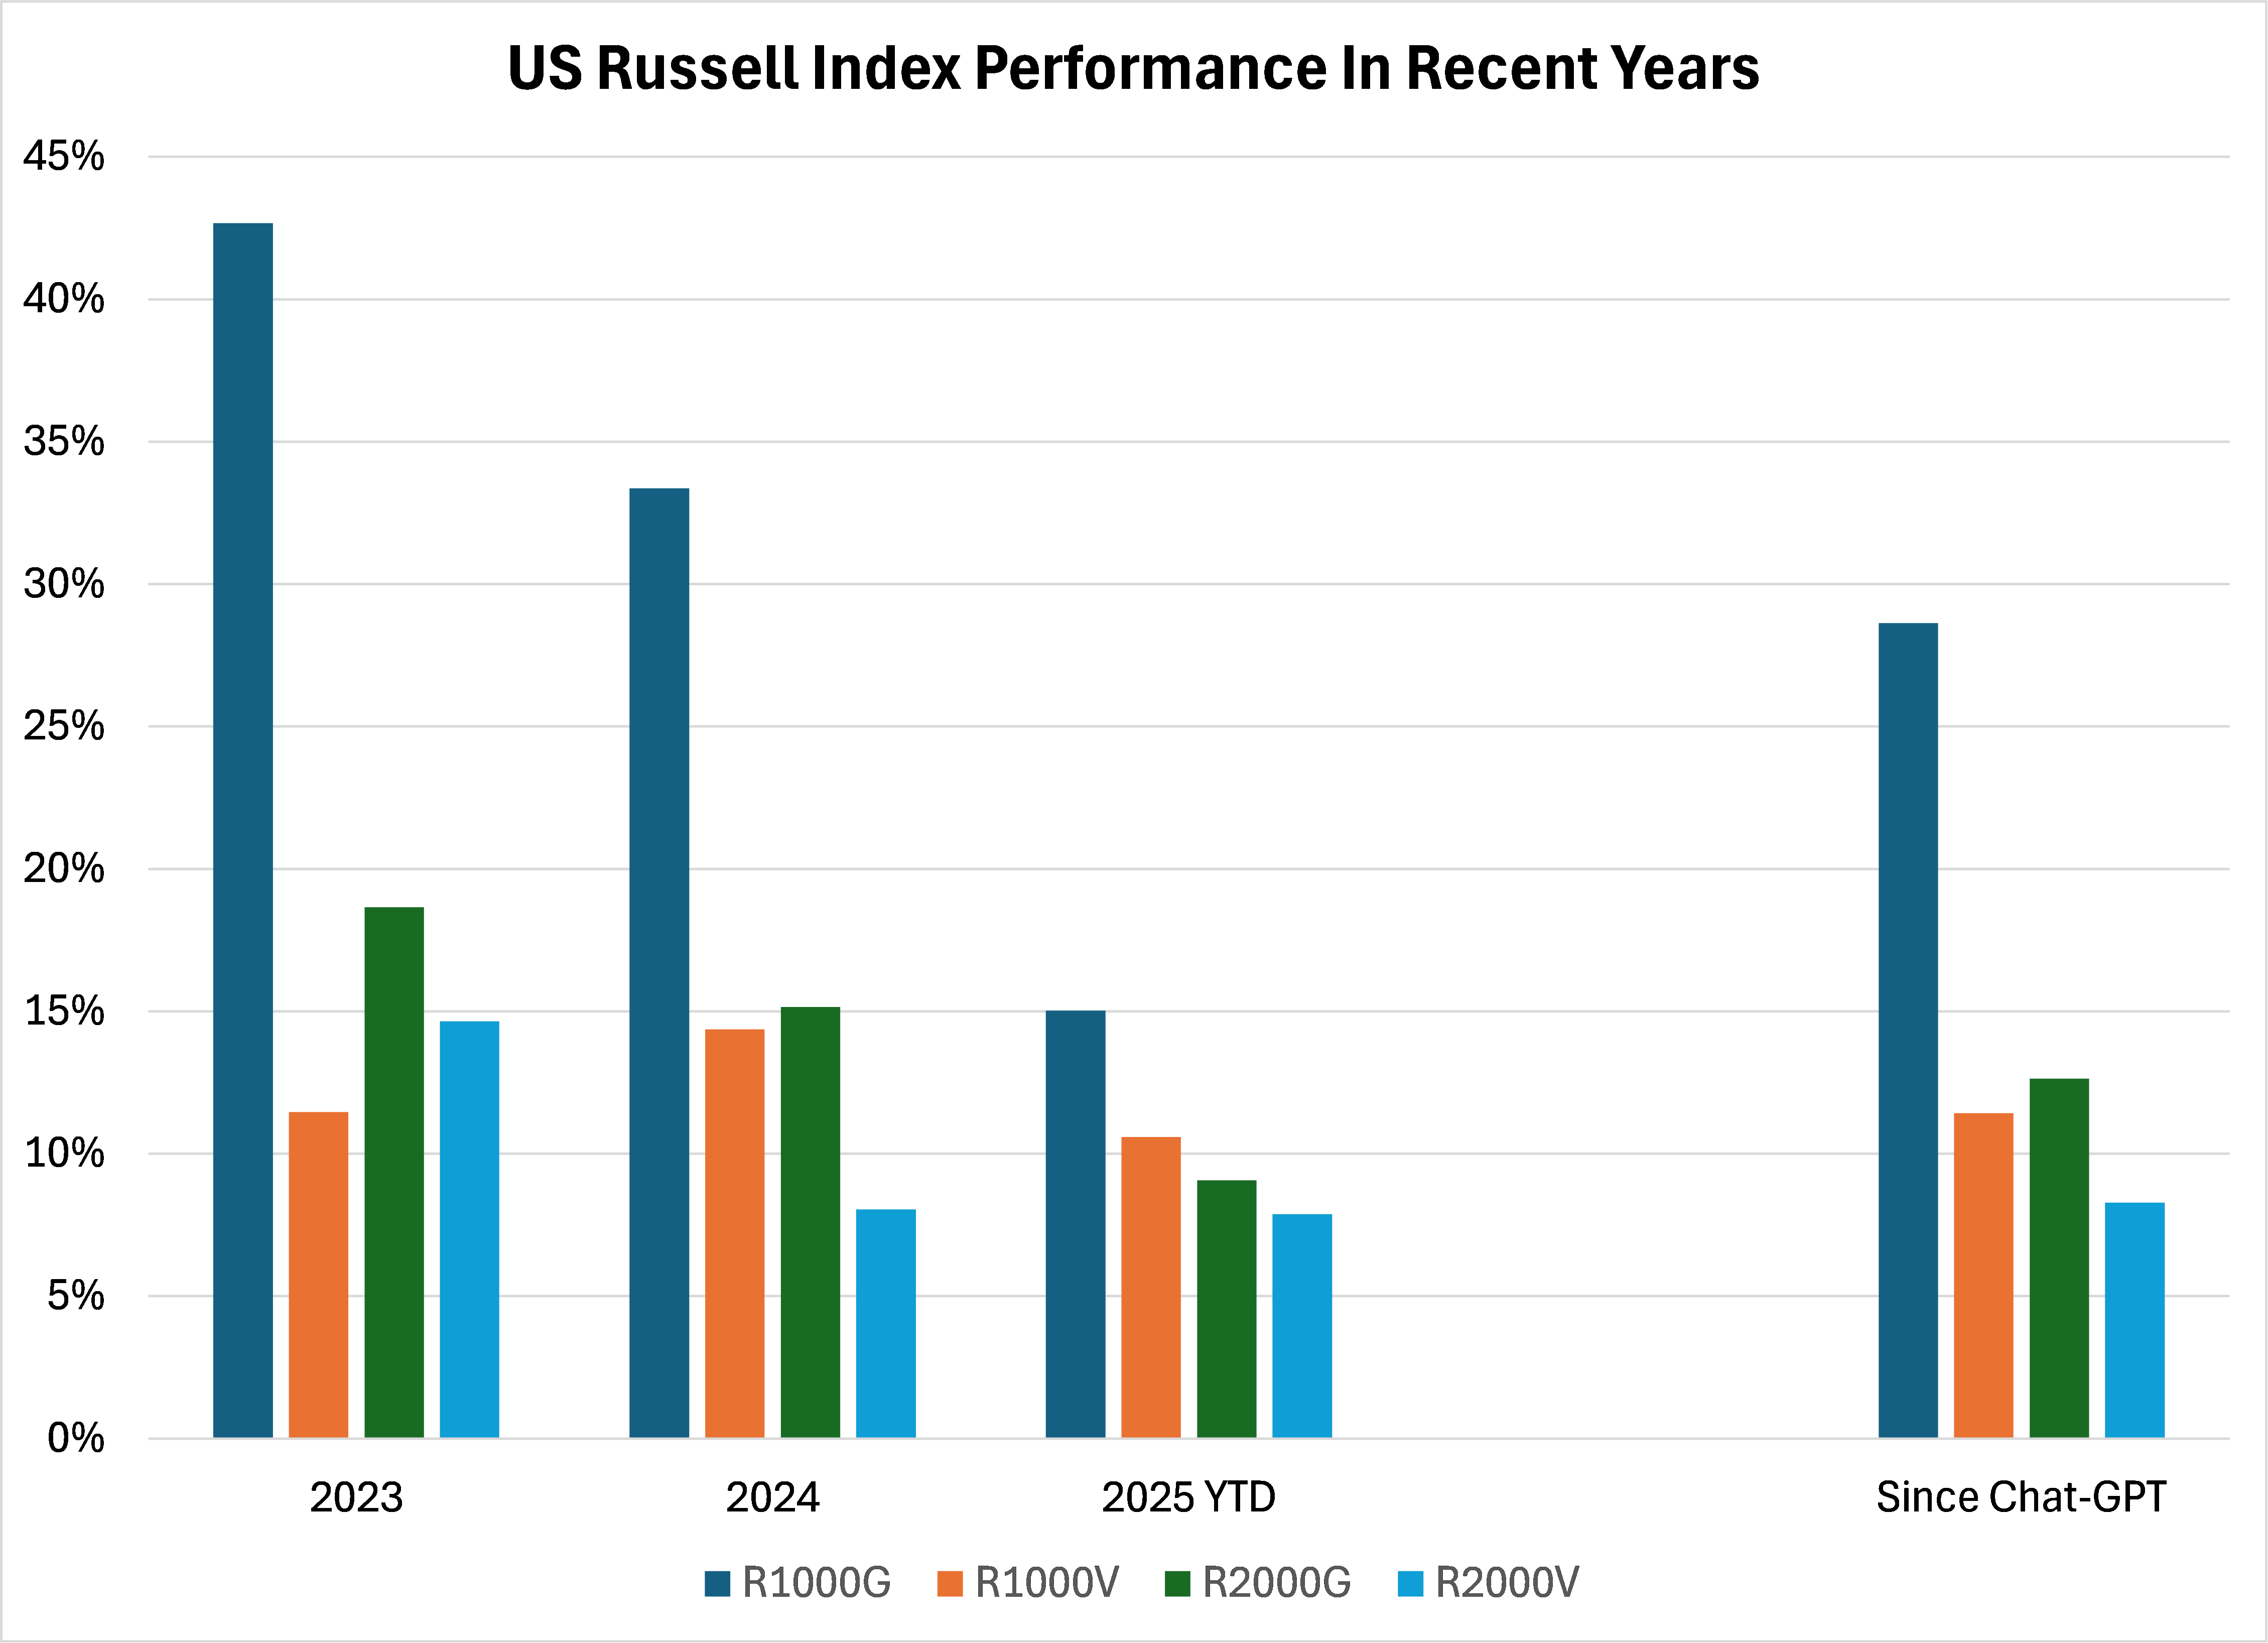
Note: “Since Chat-GPT” data set is from 11/30/2022 and is annualized. All data is calculated as of 9/12/2025.
Source: FactSet
&The post-Labor Day routine for equity analysts and portfolio managers includes travelling across the country to engage with other investors as well as with corporate executives on the “conference circuit”. These sector-specific events offer an opportunity to gauge the sentiment of peers as well as the tone of industry leaders against the backdrop of recent stock performance and macroeconomic conditions. While our research team generally prefers to meet with company executives at their headquarters and facilities rather than during half-hour speed-dating sessions on the circuit, these events can prove highly accretive to our knowledge base, and thus our investment decisions.
This year, the two over-arching questions being discussed on the circuit are: a) Will the Artificial Intelligence (AI) trade last much longer? and b) Is anything non-AI centric investable? Surely, other topics are relevant, such as updated thoughts on the health of the consumer, the second half of 2025 pricing power in the face of tariffs, and whether an upcoming rate cycle will support broader economic strength (accompanied by broader market leadership). However, for nearly the past three years, getting the AI thesis right has meant everything for equity investors. Thus, we shall begin our trip around the economy with our team’s observations from recent technology industry conferences. Other sector perspectives follow in alphabetical order.
Technology
- Fundamentally, AI data center demand shows no signs of cracking. Nearly every peer we spoke with believes this theme will eventually end badly for investors, yet the momentum trade continues unabated. Groupthink feels the highest it’s been for many years. That’s the case for both the AI data center trade (positive momentum), as well as the Software as a Service (SaaS) trade (negative momentum).
- While investors/companies don’t believe that core SaaS vendors are “going away” due to AI, there aren’t many incremental buyers today because no one can disprove the bear case. Our team is inclined to challenge this line of thinking.
- We are seeing some interesting use cases driving real tangible value. One anecdote is a business-to-business company suggesting the cost to convert a customer inquiry with AI is materially cheaper than employing a human representative. Additionally, coding remains far and away the best use case for the technology.
- We are still in discovery and test mode of what AI can do – and CEOs/CIOs are investing heavily as the fear of missing out is real.
- Despite the excitement, investors have reasons to be skeptical. The CEO of Databricks believes that we have already reached general intelligence and that large language model (LLM) improvements will largely be incremental in nature. In addition, many roadblocks remain for full enterprise AI deployment including data governance guardrails, quality and availability of data, security around AI prompting, and lack of trust in AI output. Finally, while the large hyperscalers remain flush with cash, several of the AI-native companies aggressively investing in the technology such as OpenAI, Anthropic and CoreWeave (CRWV) are not self-funded. Should enterprise adoption remain limited and/or new LLMs produce only incremental improvements in functionality, this funding could dry up.
- Lastly, M&A activity is starting to heat up, with tech corporates looking towards inorganic investments to solve for potential AI disruption.
Consumer
- Investors have split retail stocks into two groups: on-trend brands exposed to affluent consumers, and everything else. The former group, which delivered solid second quarter results has carried the momentum into the third quarter thus far. Within retail, focusing on newness and staying on-trend are critical to maintaining pricing power.
- The consumer is doing “ok”, but some slowing of activity can be observed.
- Most companies appear cautious in passing through higher costs to consumers amidst an uncertain macro environment. Most did not implement aggressive pricing actions during back-to-school season.
- Tariff impacts are expected to intensify in the second half of the year and more so in 2026. Mitigation plans including vendor negotiations, promotion adjustments and shifting of sourcing are underway.
Financials
- Current quarter updates are generally favorable, a continuation of trends from last quarter. Interestingly, companies in this sector are more positive on the consumer than those presenting at the retail conference.
- Most companies appear cautious in passing through higher costs to consumers amidst an uncertain macro environment. Most did not implement aggressive pricing actions during back-to-school season.
- Banks have performed well, and nothing communicated on the conference circuit will likely shake investors’ confidence in this group.
- Capital markets activity is picking up more quickly for the banks than the alternative asset companies, although green shoots exist.
Health Care
- Following several years of sector underperformance, attendees carry a degree of defeatism. “Why are we even here? Just buy anything technology-oriented and eliminate Health Care as a sector.” This tone should grab the attention of value investors.
- Investors are parsing management word selection and body language more than ever, leading to volatile stock reactions driven perhaps at times by miscommunication. This volatility can create opportunities for longer-term investors to trim/add to positions.
- Future budgets at many pharma and biotech companies remain up in the air due to uncertainties around tariffs and National Institute of Health (NIH) funding, as well as Most-Favored-Nation pricing. Combined with an expectation of a reduction in insured lives in 2026, further uncertainty creeps into both procedure growth and hospital economics.
- Ironically, companies are making the case as to why hospitals will continue to prioritize THEIR capex outlay or THEIR procedure growth. They can’t all be right.
- More positively, companies that are tied to utilization trends driven by the aging population and the consumers’ focus on wellness are seeing solid demand.
Industrials
- The industrial economy remains tepid outside of data center related investments (including commercial nuclear). Management teams anticipate the One Big Beautiful Bill (OBBB) will spur broader domestic investment but that hasn’t yet materialized. Additionally, run-up in some input costs like rare earths, metals and other derivatives have been pressuring margins.
- In packaging, companies continue to experience depressed volumes due to tariff uncertainty. Customers are ordering the bare minimum needed especially if they have cross border business with Canada or Mexico.
- Conditions in residential housing markets are weak and have deteriorated quite rapidly. Perhaps rate cuts on the horizon can provide a catalyst for fundamentals to improve, but company commentary suggests things will get worse before they get better.
- On HVAC, Carrier (CARR) lowered its third quarter earnings-per-share (EPS) guidance, pointing to both a weak consumer and excess channel inventory. While Trane didn’t officially cut its EPS guide, the company highlighted that its residential market will now decline high-single-digits in the third quarter versus a prior expectation of flat. Lennox similarly acknowledged the weak environment.
- Core & Main (CNM) pointed to weaker residential construction markets, especially in the Sunbelt. The third quarter outlook for this company’s residential market is now down low-double-digits versus prior guidance of flat.
- Within building products, current consensus is that a 50 basis points (bps) cut on the front end of the curve will jump start some commercial projects (multifamily), while a 50 bps decline in the 30-year mortgage rate will spur some activity on the residential side.
- On a positive note, for higher quality companies (higher margin, non-commodity), the impact of tariffs has been less-than-feared. Companies have adapted quickly with price increases, shifts in supply chains and swapping out high-cost suppliers.
Thanks for reading, and remember to never skip a Beat – Eric
Stocks: Carrier (CARR), Core & Main (CNM), CoreWeave (CRWV)
Source: FactSet®. FactSet is a registered trademark of FactSet Research Systems, Inc.
Sectors are based on the Global Industry Classification Standard (GICS®) classification system. Global Industry Classification Standard (GICS®) and “GICS” are service makers/trademarks of MSCI and Standard & Poor’s. FactSet ® is a registered trademark of FactSet Research Systems, Inc. APX® is a trademark of Advent Software Systems.
The views expressed are those of the author and Brown Advisory as of the date referenced and are subject to change at any time based on market or other conditions. These views are not intended to be and should not be relied upon as investment advice and are not intended to be a forecast of future events or a guarantee of future results. Past performance is not a guarantee of future performance and you may not get back the amount invested. The information provided in this material is not intended to be and should not be considered to be a recommendation or suggestion to engage in or refrain from a particular course of action or to make or hold a particular investment or pursue a particular investment strategy, including whether or not to buy, sell, or hold any of the securities mentioned. It should not be assumed that investments in such securities have been or will be profitable. To the extent specific securities are mentioned, they have been selected by the author on an objective basis to illustrate views expressed in the commentary and do not represent all of the securities purchased, sold or recommended for advisory clients. The information contained herein has been prepared from sources believed reliable but is not guaranteed by us as to its timeliness or accuracy, and is not a complete summary or statement of all available data. This piece is intended solely for our clients and prospective clients, is for informational purposes only, and is not individually tailored for or directed to any particular client or prospective client.
An investor cannot invest directly into an index.
Russell 1000® Growth Index measures the performance of the large-cap growth segment of the U.S. equity universe. It includes those Russell 1000® Index companies with higher price-to-book ratios and higher forecasted growth values. The Russell 1000® Growth Index is constructed to provide a comprehensive and unbiased barometer for the large-cap growth segment. The Index is completely reconstituted annually to ensure that new and growing equities are included and that the represented companies continue to reflect growth characteristics.
The Russell 1000® Value Index measures the performance of the large-cap value segment of the U.S. equity universe. It includes those Russell 1000 companies with lower price-to-book ratios and lower expected and historical growth rates. The Russell 1000® Value Index is constructed to provide a comprehensive and unbiased barometer for the large-cap value segment. The Index is completely reconstituted annually to ensure new and growing equities are included and that the represented companies continue to reflect value characteristics.
The Russell 2000® Growth Index measures the performance of the small-cap growth segment of the U.S. equity universe. It includes those Russell 2000 Index companies with higher price-to-value ratios and higher forecasted growth values. The Russell 2000® Index consists of the smallest 2,000 companies in a group of 3,000 U.S. companies in the Russell 3000 Index, as ranked by market capitalization.
Russell 2000® Value Index measures the performance of the small-cap value segment of the U.S. equity universe. It includes those Russell 2000® Index companies with lower price-to-book ratios and lower forecasted growth values. The Russell 2000® Value Index is constructed to provide a comprehensive and unbiased barometer for the small-cap value segment. The Index is completely reconstituted annually to ensure new and growing equities are included and that the represented companies continue to reflect value characteristics.
Russell® and other service marks and trademarks related to the Russell indexes are trademarks of the London Stock Exchange Group Companies. An investor cannot invest directly into an index.
Earnings per share (EPS) is calculated as a company's profit divided by the outstanding shares of its common stock.