
This week I’ve been ruminating about the value of and differences between the words ‘time’ and ‘timing’. Both carry significance in society – ‘timing is everything’, yet ‘the two most powerful warriors are patience and time’. In equity investing, on the surface we tend to shun the idea of timing markets (in the “too hard” bucket), and applaud the concept of time in the market due to the beauty of compounding. Yet, short-term information is sometimes useful to longer-term thinkers. And let’s face it, our clients often ask for a helping or two of short-term information (with a side of market timing thoughts, please).
In the spirit of recognizing value in an awareness of the short-term while at the same time keeping our eyes on the long-term, this post attempts to provide anecdotes and data points that allow us to satiate our needs across both horizons.
Timing/Short-Term
Historically, when our analyst team downgrades many more stocks than they upgrade over a particular month, in the following month the S&P 500® Index return has tended to be weak. In addition, the best month of market performance since the end of 2017 (April 2020) coincided with the largest differential in analyst upgrades versus downgrades the month prior (March 2020). The chart below is admittedly busy but try to focus on the idea that tall bars in either direction often result in orange circles in that same direction.
Historically, One-Sided and Pronounced Changes to Our Analysts' Thinking Have Preceded A Similar Market Reaction In The Following Month
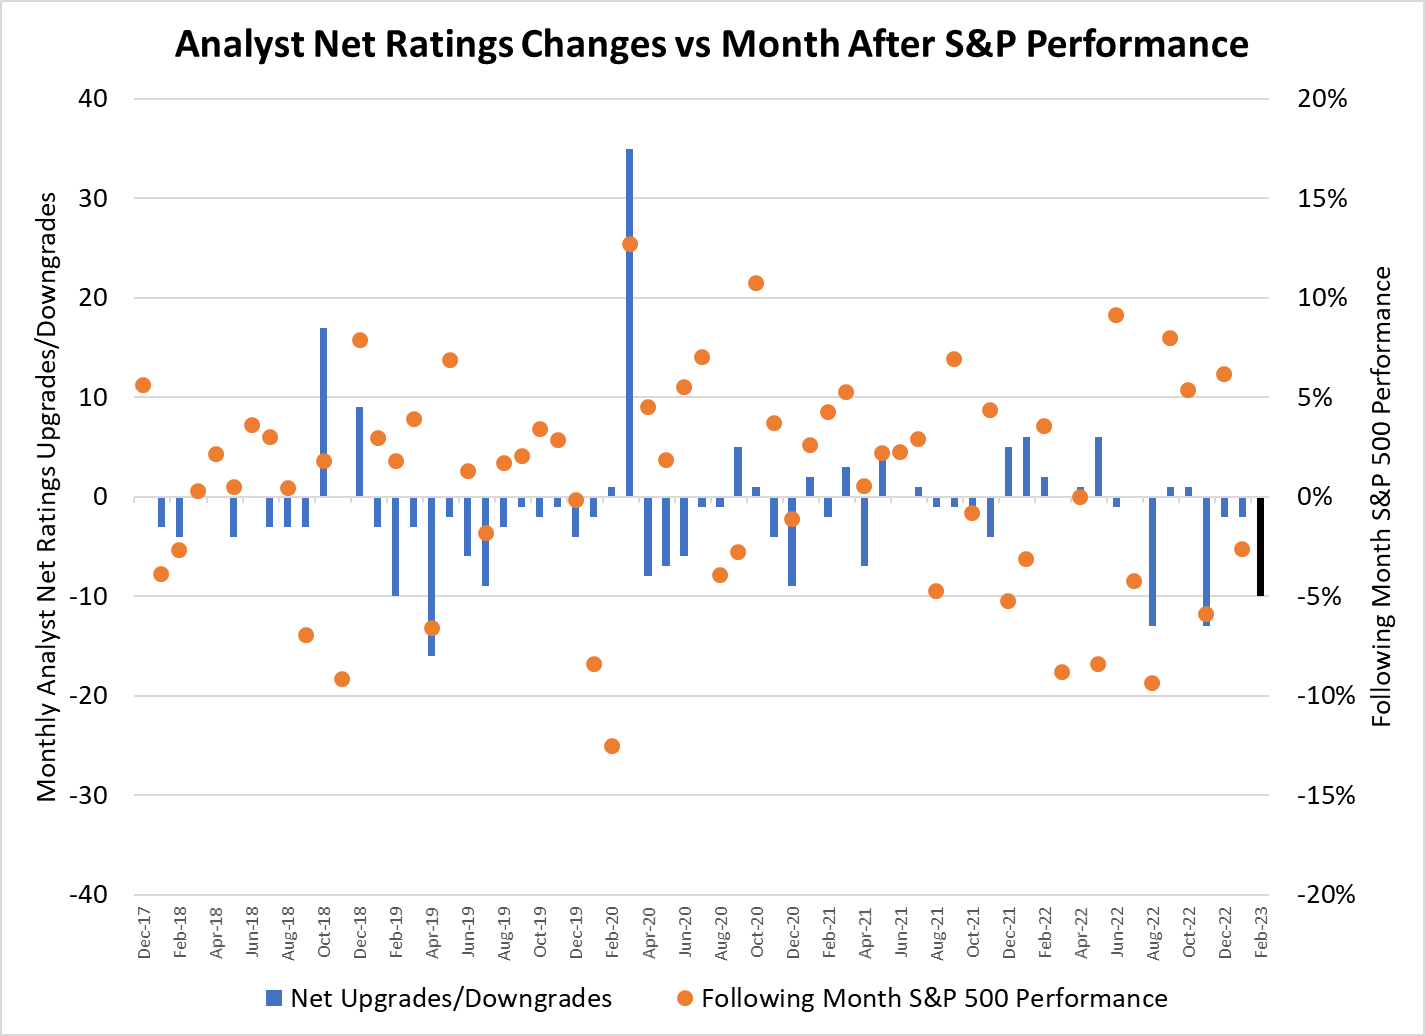
Source: FactSet, Brown Advisory analysis. As of 02/28/2023.
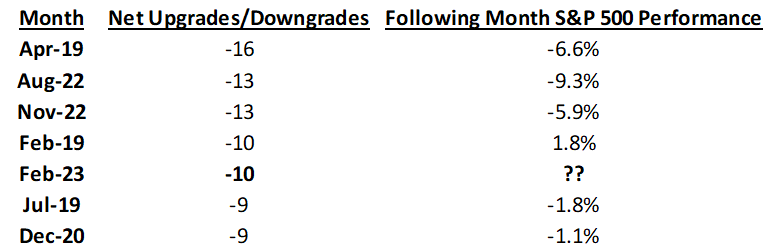
Last month, our analyst team downgraded 15 stocks while upgrading only five. This ties for the fourth greatest negative monthly differential between upgrades and downgrades (-10) since the end of 2017. As you see in the table below, the analyst team has been very good tactically – the market has been particularly ugly in the month following our most bearish changes in ratings. If equity markets are in the red in March, we'll know why.
Source: FactSet.
When companies report earnings, it’s often interesting to look back at commentary from the prior quarter to gauge sentiment and changes to outlook on the margin. Earlier this week, home improvement company Lowe’s (LOW) reported fourth quarter results. While the company’s guidance for 2023 was largely consistent with consensus expectations, the stock took a hit as on the margin, commentary from typically upbeat CEO Marvin Ellison was just a tad downbeat relative to November.
LOW Third Quarter Conference Call Comments (November 2022) | LOW Fourth Quarter Conference Call Comments (This Week) |
"We're encouraged to hear that Pros remain optimistic with over 70% saying they expected EVEN MORE work in 2023." | "More than 70% of Pros stated that they were booked out the SAME OR MORE compared to 2022." |
"We aren't seeing anything that feels or looks like a trade down or consumer pullback." | "Consumers are weary of a potential recession...reflected in some of the discretionary pullback we experienced during the holiday season." |
Source: FactSet.
Now, to be fair LOW did state that monthly comps improved through the quarter as the company moved past the more discretionary holiday season. Still, even if the numbers aren’t moving, the sentiment is somewhat less favorable today than it was in November.
The final piece of short-term thinking relates to the level of concentrated performance attribution the large cap indices demonstrated during the first two months of the year. Whether growth, value, or global in nature, just a handful of stocks accounted for the bulk of each index return year-to-date. In other words, if you are underweight these few names, your relative performance has likely been challenged YTD.
Contribution to YTD Return | Russell 1000 Growth | Russell 1000 Value | S&P 500 Index | MSCI All Country World |
Top 5 | 4.7% | 1.0% | 2.7% | 1.5% |
All Others | 2.3% | 0.5% | 1.0% | 2.6% |
Total | 7.0% | 1.5% | 3.7% | 4.1% |
# of Constituents in Index | 519 | 863 | 515 | 2,893 |
Top 5 Contribution % | 66.9% | 67.9% | 72.7% | 37.6% |
Top 5 as % of All Constituents | 1.0% | 0.6% | 1.0% | 0.2% |
Top 5 Contributors (in order) | Apple | Meta | Apple | Apple |
Nvidia | JP Morgan | Tesla | Nvidia | |
Tesla | Salesforce | Nvidia | Meta | |
Amazon | Disney | Meta | Meta | |
Microsoft | Wells Fargo | Amazon | Amazon |
Source: FactSet, as of 02/28/2023.
Time/Long-Term
We recently met with the management team of Intuitive Surgical (ISRG). One of our portfolio managers, Ken Stuzin will tell you that none of our holdings are “sacred cows”, but in the same breath he’ll mention that ISRG CEO Gary Guthart is among the very best executives that he’s ever met. Gary became CEO in 2010, and by 2014 he realized that his sales team needed to change its approach. The company had already established itself as the pioneer and leader in robotic/minimally invasive surgery. However, ISRG was receiving sub-par net promoter scores from hospital (client) administrators, which created incentive for hospitals to consider alternatives to ISRG (fortunately, there were/are very few that can compete).
Intuitive Surgical Stock Has Outperformed Both the Russell 1000 Growth and S&P 500 Indices Over Gary Guthart's Tenure as CEO
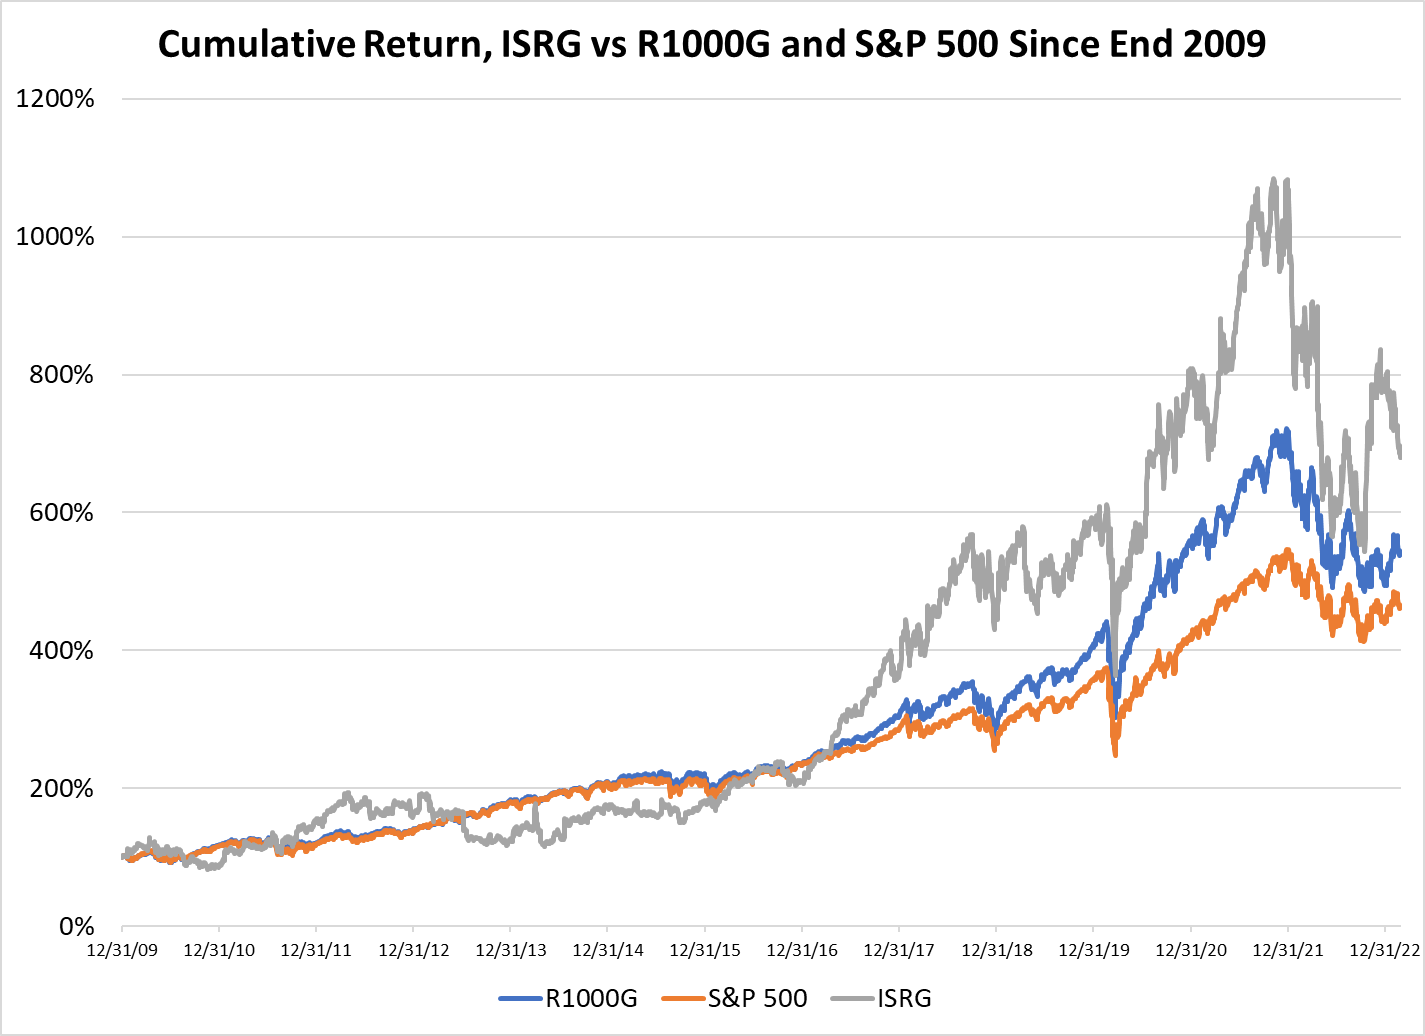
Source: FactSet, as of 12/31/2022.
From the start, the company’s sales team was very aggressive as a start-up needs to be. However, given ISRG’s strong market penetration by 2014, Guthart realized a new approach was needed in order to build better relationships with customers. He told his sales team that their job was very simply to help fulfill the mission of each hospital the company serves. Some of his salespeople left or were let go, thinking Gary’s approach was turning too ‘soft’, but by engaging with customers in the right way over time, ISRG now receives net promoter scores above those of Medtronic and Johnson & Johnson from hospital executives. The company remains the market leader by a long way. It took a long time for the sales team to get it right, but at this point the cultural change “has stuck” according to Gary.
This Is What 25% CAGR Over 15 Years Looks Like; It's Likely ISRG's Greatest Competitive Advantage Going Forward
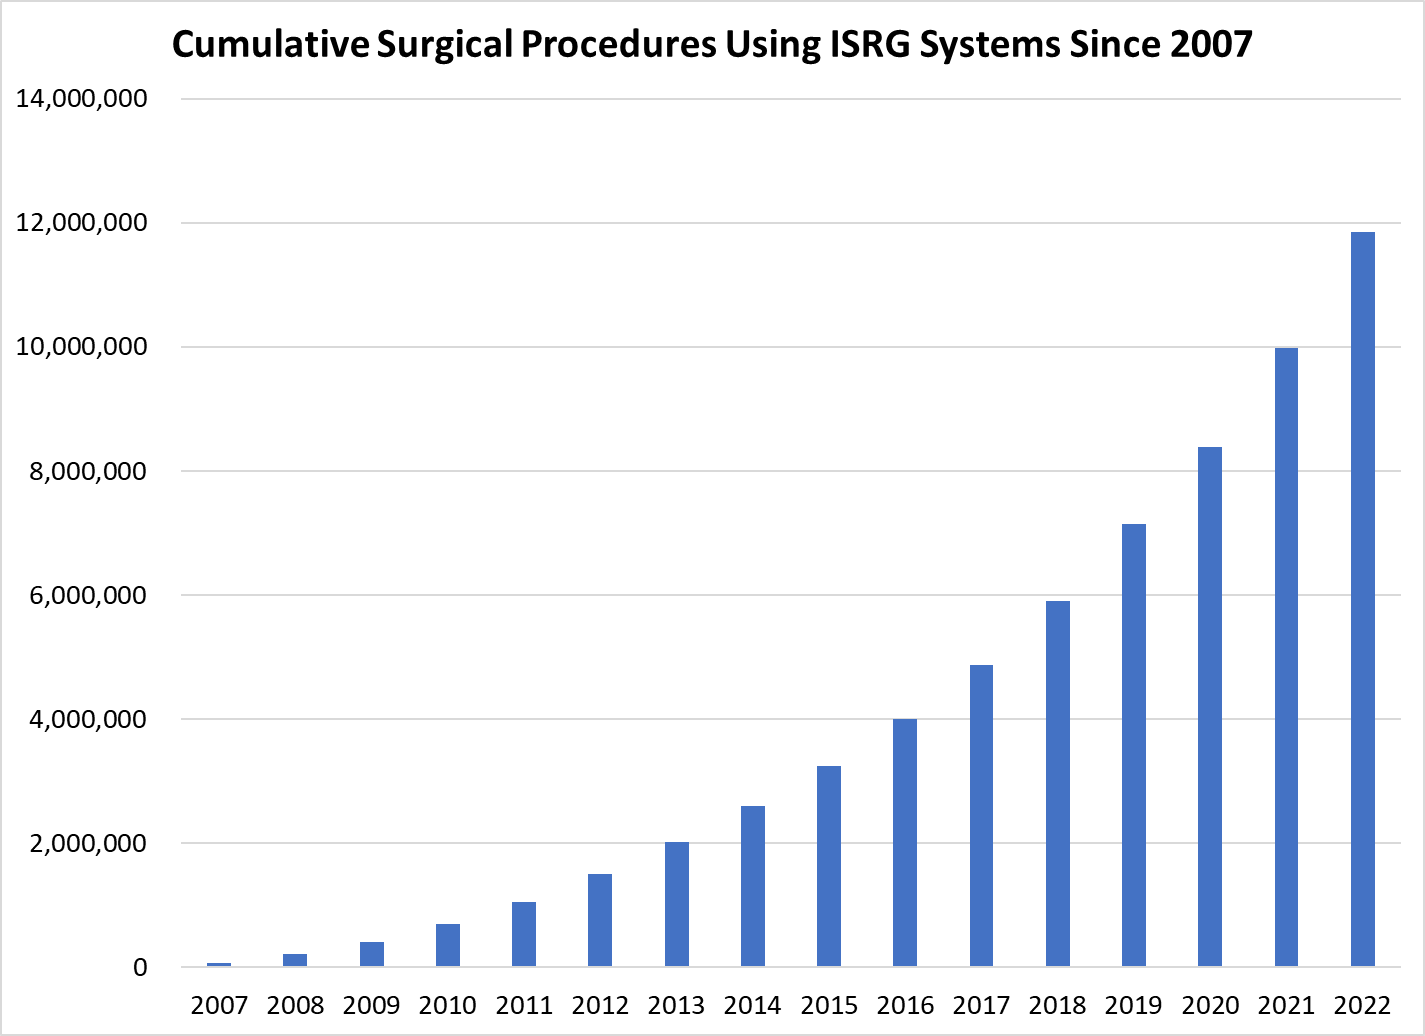
Source: FactSet, as of 12/31/2022.
Gary talked about the “compounding” nature of procedure growth at ISRG over the years, and the vast amount of data ISRG obtains from these procedures. While we believe that innovation will continue to change the scope of robotic surgery over time, ISRG’s established lead from gathering data from more than ten million procedures to date should only help the company partner with and train future surgeons more effectively. The chart above shows what a 25% CAGR (procedure growth) over the past 15 years looks like in cumulative terms.
Even Longer-Term
At the front of every Berkshire Hathaway (BRK) annual shareholder letter penned by CEO Warren Buffett, the company presents the stock’s performance versus the S&P 500 Index since inception. This year’s letter is no different (published last weekend), demonstrating the stock’s annual gain of 19.8% since 1964! That return compares favorably to the S&P 500 Index’s total compound return of 9.9% (still positive and above inflation). The chart below shows the difference between 19.8% compounded versus 9.9% over the course of 58 years, based on an initial (fortunate) investment of $10,000 in BRK and the Index in 1964.
You Could Buy A Jumbo Jet Today If You Invested $10,000 in BRK in 1964...and Just Kept It There
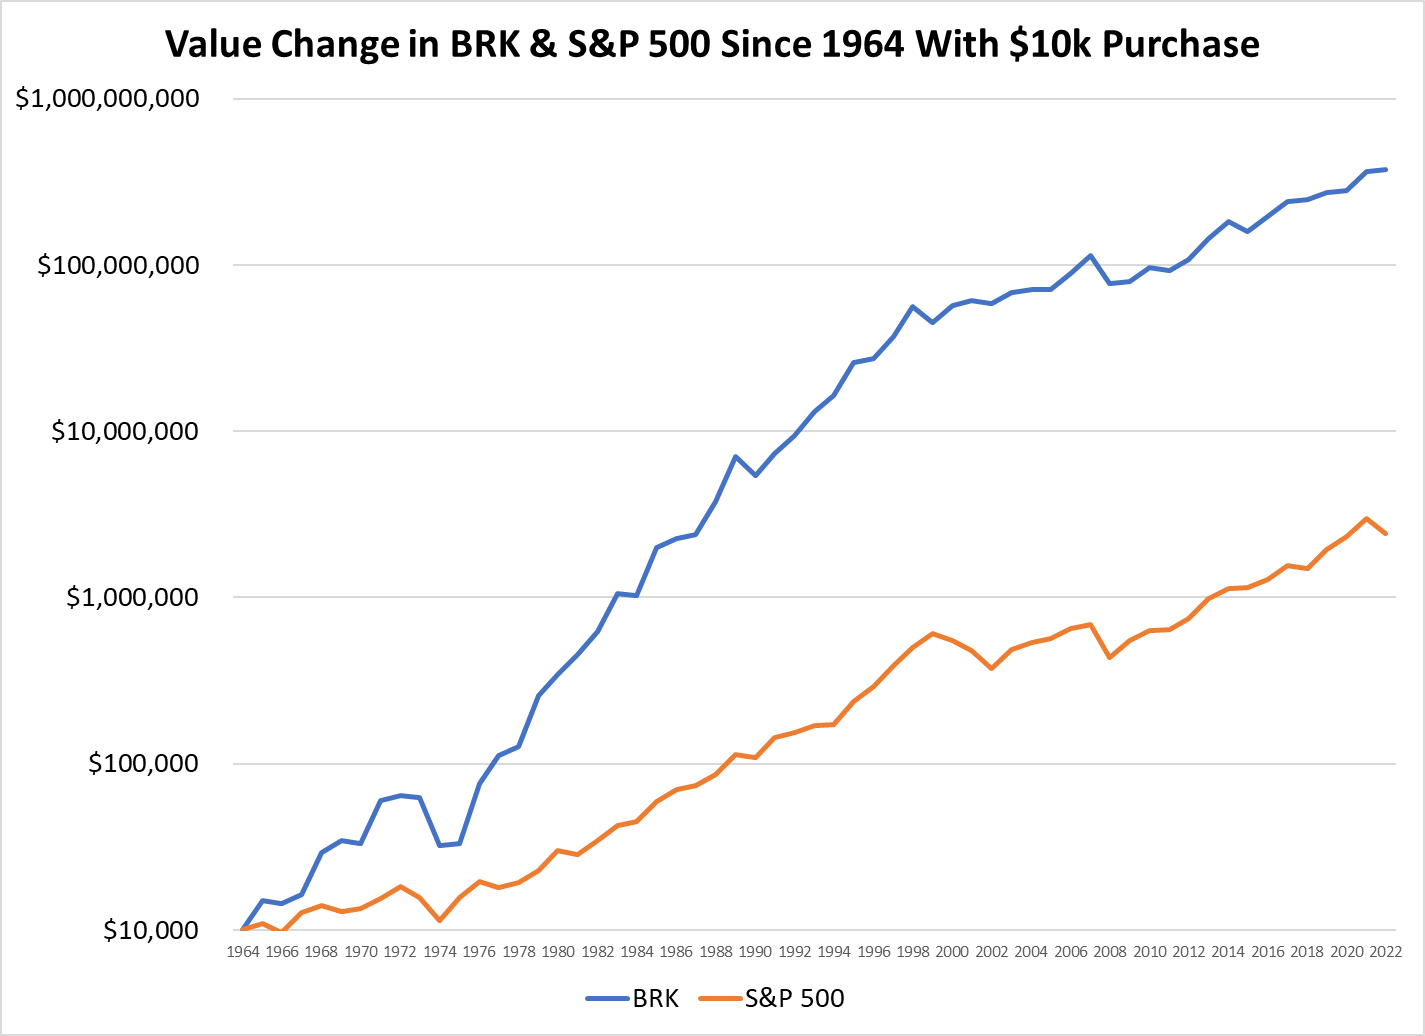
Source: FactSet. As of 12/31/2022. Dividends reinvested for S&P 500. Berkshire Hathaway does not pay a dividend.
This isn’t monopoly money, folks. Your initial $10,000 in Berkshire stock in 1964 (purchasing power of about $100,000 today) would now be worth a very cool $377.8 million (before taxes paid on gains). That’s how insane the power of compounding is over a very long period of time. The chart uses a logarithmic scale because the $2.4 million one would have earned after investing in the S&P 500 Index would otherwise not even be visible in comparison with Berkshire.
Last comment – and in defense of active management. Over the very long term, small changes in the rate at which one compounds their investments can make a huge difference. A 10% CAGR over 58 years has the potential to convert a $10,000 initial investment into $2.5 million. An approximation of the nice nest egg you might have if you had invested in the market Index in 1964. However, if you were able to find a set of active managers that collectively delivered 250 basis points (bps) of annualized outperformance over that same time frame, your investment at the end of the period would likely be close to four times larger than the $2.5 million provided by the Index. Even “only” 100 bps of annualized outperformance (easier said than done) would have nearly doubled your pre-tax value versus the Index. The fact that Buffett's BRK has outperformed the market by 1,000 bps annualized for more than half a century may go down as the greatest investment achievement in the history of the stock market.
Small Differences In the Compounding Rate Over Long Periods of Time = Huge Differences In Value
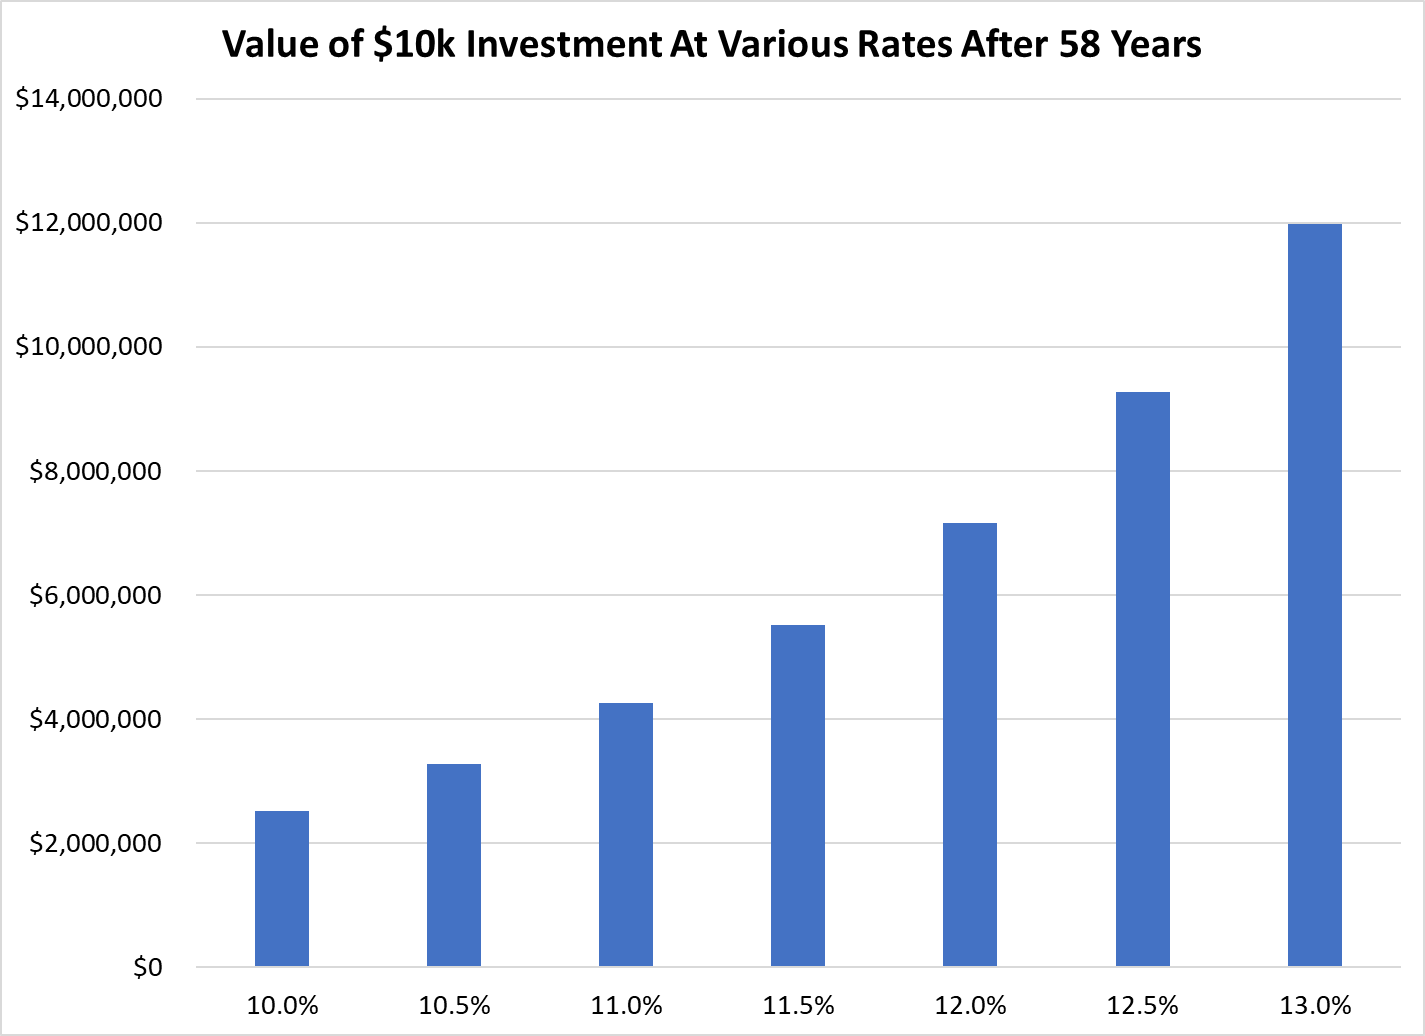
Source: FactSet. As of 12/31/2022.
Make sure that time is on your side!
Thanks for reading, and remember to never skip a Beat - Eric ![]()
The views expressed are those of the author and Brown Advisory as of the date referenced and are subject to change at any time based on market or other conditions. These views are not intended to be and should not be relied upon as investment advice and are not intended to be a forecast of future events or a guarantee of future results. Past performance is not a guarantee of future performance and you may not get back the amount invested. The information provided in this material is not intended to be and should not be considered to be a recommendation or suggestion to engage in or refrain from a particular course of action or to make or hold a particular investment or pursue a particular investment strategy, including whether or not to buy, sell, or hold any of the securities mentioned. It should not be assumed that investments in such securities have been or will be profitable. To the extent specific securities are mentioned, they have been selected by the author on an objective basis to illustrate views expressed in the commentary and do not represent all of the securities purchased, sold or recommended for advisory clients. The information contained herein has been prepared from sources believed reliable but is not guaranteed by us as to its timeliness or accuracy, and is not a complete summary or statement of all available data. This piece is intended solely for our clients and prospective clients, is for informational purposes only, and is not individually tailored for or directed to any particular client or prospective client.
The S&P 500® Index represents the large-cap segment of the U.S. equity markets and consists of approximately 500 leading companies in leading industries of the U.S. economy. Criteria evaluated include market capitalization, financial viability, liquidity, public float, sector representation and corporate structure.
The Russell 1000® Growth Index measures the performance of the large-cap growth segment of the U.S. equity universe. It includes those Russell 1000 Index companies with higher price-to-book ratios and higher forecasted growth values. The Russell 1000® Value Index measures the performance of the large-cap value segment of the U.S. equity universe. It includes those Russell 1000 Index companies with lower price-to-book ratios and lower forecasted growth values.
Frank Russell Company (“Russell”) is the source and owner of the trademarks, service marks and copyrights related to the Russell Indexes. Russell® is a trademark of Frank Russell Company. Neither Russell nor its licensors accept any liability for any errors or omissions in the Russell Indexes and / or Russell ratings or underlying data and no party may rely on any Russell Indexes and / or Russell ratings and / or underlying data contained in this communication. No further distribution of Russell Data is permitted without Russell’s express written consent. Russell does not promote, sponsor or endorse the content of this communication.
The MSCI All Country World Index (ACWI) is a stock index designed to track broad global equity-market performance. An index constituent must also be considered a U.S. company. Standard & Poor’s, S&P, and S&P 500® are trademarks/service marks of MSCI and Standard & Poor’s.
The compound annual growth rate (CAGR) measures an investment's annual growth rate over a period of time.
Factset® is a registered trademark of Factset Research Systems, Inc.