
It’s been a very mysterious year for “quality” investing thus far. The search for discovering stocks that compound over time often leads us to businesses that require limited capital investment with strong profit margins and high levels of free cash flow. Often, these businesses establish and maintain a competitive moat from ownership of proprietary data, regulatory advantages and/or innovation that leads to product/service superiority. Put simply, they rarely need to reinvest heavily to grow, which often leads to clean balance sheets and shareholder-friendly uses of cash, including buybacks, dividends and opportunistic acquisitions. While broad in economic scope, the stocks of these companies tend to perform well over the long-run, and especially at times when capital is scarce and discipline is rewarded.
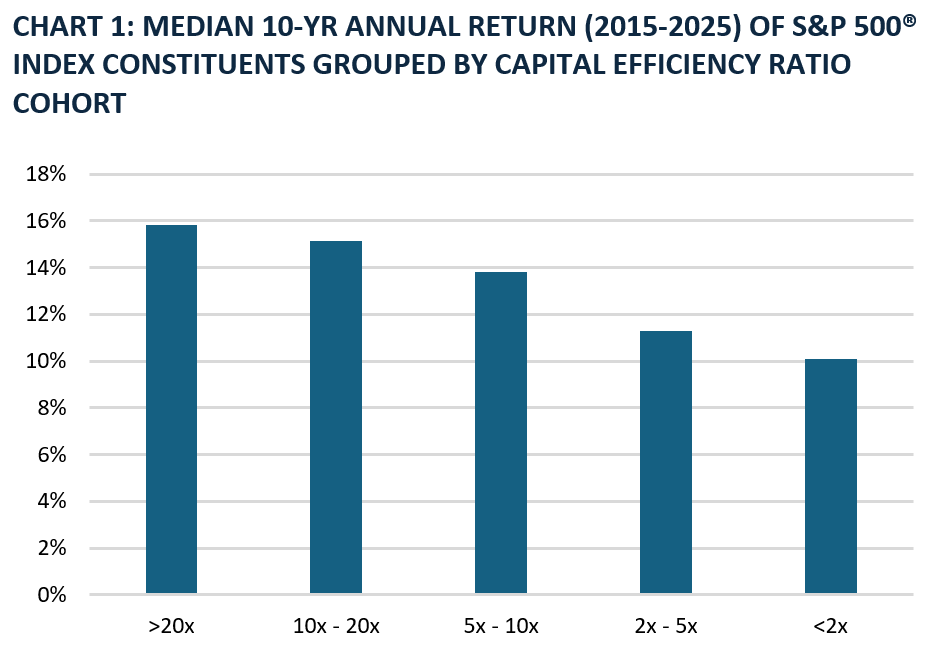
Source: FactSet. Data as of April 10, 2026. Note: Capital Efficiency ratio is defined as cash flow from operations divided by capital expenditures.
Over the trailing decade, we’ve seen the most capital efficient companies outperform others. A simple measure of capital efficiency is cash flow from operations divided by capital expenditures (the “CE ratio”). Over a decade, this ratio based on the cumulative cash inflows and outflows is a telling gauge of a company’s capital efficiency. While companies are rewarded in equity markets for more than solely an efficient use of capital – perceived longevity of competitive moat and growth drivers are also essential – from 2015 through 2025, this metric led the way. Among current constituents of the S&P 500 Index, the median ten-year annual stock return for a company with a CE ratio above 20x was nearly 600 basis points better than a company with a CE ratio below 2x. Compounded over ten years, that differential in performance is a mile wide. To quantify, that’s a cumulative return of 335% versus 162%.
For fans of the Netflix show from which the title of this write-up originated, many quality-oriented investors feel as though they’ve been living in the “Upside Down” through early April. In fact, the cold, dreadful, dystopian version of the fictional town of Hawkins, Indiana might be an upgrade to the stock market environment through which they’ve been navigating. Demogorgons have viciously attacked the perceived long-term prospects of many asset-light businesses in the name of artificial intelligence (AI) disintermediation. It’s as if Vecna himself has convinced equity market participants to fear asset light business models, and instead, take comfort in asset-intensive businesses where obsolescence risk is low (the “HALO” (Heavy Assets, Low Obsolescence) effect of 2026).
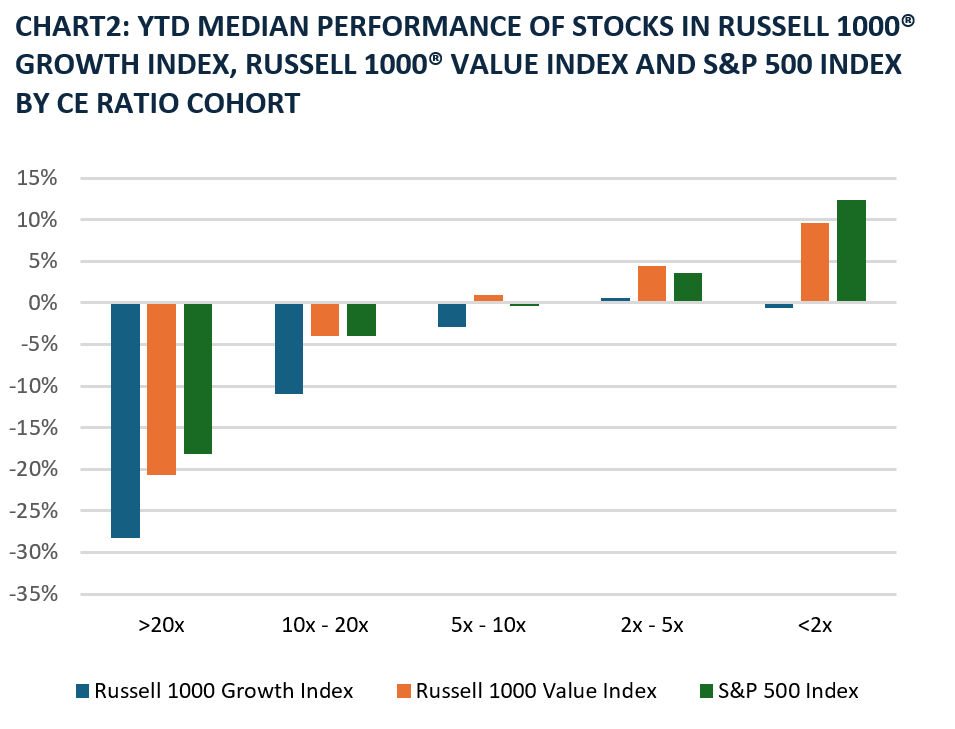
Source: FactSet. Data as of April 10, 2026.
Growth, value, and core indices have all experienced an Upside Down moment year-to-date, with roughly a 30% (3,000 basis points) level of outperformance of the least capital efficient companies compared with the best. Companies with low CE ratios are typically those in the Utilities sector, combined with old economy businesses within Materials, Industrials, and Energy sectors. Many companies in these sectors are price takers most, if not all, of the time, own depleting assets, and must endure cyclical peaks and troughs based on unpredictable economic and geopolitical scenarios, all of which makes capital allocation, to put it mildly, challenging. For the Russell 1000 Growth Index, companies at the low end of the capital efficiency spectrum for this year (those with a CE ratio below 2x) include bellwethers Amazon (AMZN), Alphabet (GOOG), Walmart Inc (WMT), and Meta Platforms Inc (META).
Future free cash flow generation remains a question mark for these hyperscalers, which continue to accelerate data center related investment. WMT, which currently trades at a forward P/E above 40x and hasn’t been this expensive since the Clinton administration, is viewed as a haven away from the toxic, spore-filled parallel dimension also known as capital-light investing.
Sticking to valuation, across both the growth and value indexes, we are now seeing the least capital efficient companies strangely trading at meaningful valuation premiums to those with the highest CE ratios. Within the Russell 1000 Value Index, Utilities, Energy, and Materials stocks are trading at P/E ratios above asset-light Technology, Health Care and Communication stocks. In the Russell 1000 Growth Index, software and asset-light Financials and Industrials companies are broadly trading at a discount to energy pipelines, fast-service restaurants and airlines. These gaps in P/E valuation are other-worldly, as companies with CE ratios above 20x are trading, on average, at a 5.5x and 2.5x discount to those companies with CE ratios under 2x in the Russell 1000 Growth Index and Russell 1000 Value Index, respectively. Only a few months ago, at year-end 2025, the highest-CE-ratio companies traded at a premium to the lowest-CE-ratio companies for both Indexes as shown in the chart below.
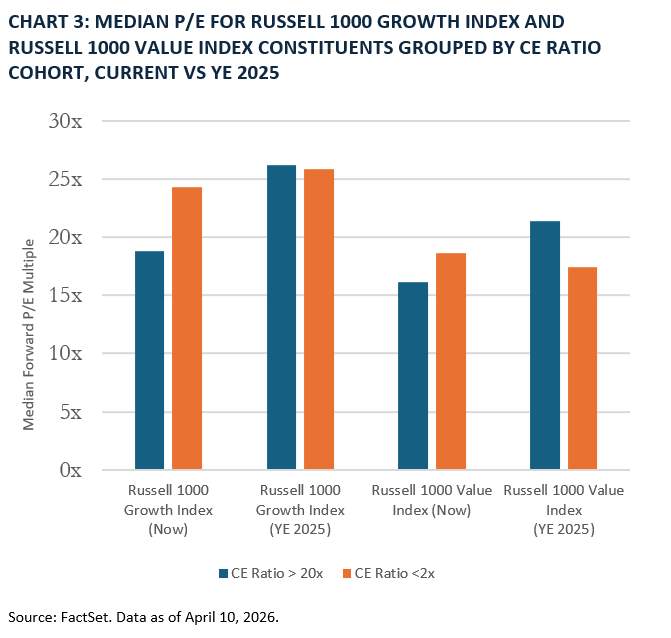
Source: FactSet. Data as of April 10, 2026.
There are points in an economic cycle when capital intensive stocks do tend to outperform. Heavy-asset businesses typically benefit from significant operating leverage due to their collective large fixed-cost bases. Early in an economic recovery, rising utilization can spread fixed costs across a broader volume base, and incremental profit and margin levels are often substantially higher than baseline levels. This is usually the “Goldilocks” environment for low-CE-ratio companies and stocks. That is not the environment in which we find ourselves. Thus, their outperformance year-to-date has been nothing short of stunning.
One could conclude, that after just three months of the year, quality-oriented equity investors are already “Running Up That Hill” of relative performance to catch up to their benchmarks (just couldn’t pass up that reference).
It remains to be seen how investors choose to define “quality” in the future, but I suspect it won’t change drastically from today. Competitively advantaged companies defined by moat longevity, growth trajectory and capital efficiency, will likely remain at the forefront of the description. The question of whether advancements in generative AI will interrupt those companies advantaged today is a reality. The market’s exceptional response to that question year-to-date feels surreal, bordering on supernatural.
Thanks for reading, and remember to never skip a Beat – Eric
Source: FactSet®. FactSet is a registered trademark of FactSet Research Systems, Inc.
The views expressed are those of the author and Brown Advisory as of the date referenced and are subject to change at any time based on market or other conditions. These views are not intended to be and should not be relied upon as investment advice and are not intended to be a forecast of future events or a guarantee of future results. Past performance is not a guarantee of future performance and you may not get back the amount invested. The information provided in this material is not intended to be and should not be considered to be a recommendation or suggestion to engage in or refrain from a particular course of action or to make or hold a particular investment or pursue a particular investment strategy, including whether or not to buy, sell, or hold any of the securities mentioned. It should not be assumed that investments in such securities have been or will be profitable. To the extent specific securities are mentioned, they have been selected by the author on an objective basis to illustrate views expressed in the commentary and do not represent all of the securities purchased, sold or recommended for advisory clients. The information contained herein has been prepared from sources believed to be reliable but is not guaranteed by us as to its timeliness or accuracy, and is not a complete summary or statement of all available data. This piece is intended solely for our clients and prospective clients, is for informational purposes only, and is not individually tailored for or directed to any particular client or prospective client.
An investor cannot invest directly into an index.
Sectors are based on the Global Industry Classification Standard (GICS ®) classification system. Global Industry Classification Standard (GICS®) and “GICS” are service makers/trademarks of MSCI and Standard & Poor’s.
The S&P 500® Index is a capitalization weighted index of 500 stocks that is designed to measure performance of the broad domestic economy through changes in the aggregate market value of 500 stocks representing all major industries. Index returns assume reinvestment of dividends and do not reflect any fees or expenses. Benchmark returns are not covered by the report of the independent verifiers. Standard & Poor’s, S&P®, and S&P500® are registered trademarks of Standard & Poor’s Financial Services LLC (“S&P”), a subsidiary of S&P Global Inc.
The Russell 1000® Growth Index measures the performance of the large‑cap growth segment of the U.S. equity universe and includes Russell 1000 companies with relatively higher price‑to‑book ratios, higher forecast growth and higher historical sales per share growth; the index is completely reconstituted annually.
The Russell 1000® Value Index measures the performance of the large-cap value segment of the U.S. equity universe. It includes those Russell 1000 companies with lower price-to-book ratios and lower expected and historical growth rates. The Russell 1000® Value Index is constructed to provide a comprehensive and unbiased barometer for the large-cap value segment. The Index is completely reconstituted annually to ensure new and growing equities are included and that the represented companies continue to reflect value characteristics. The Russell 1000® Value Index and Russell® are trademarks/service marks of the London Stock Exchange Group companies. An investor cannot invest directly into an index. Benchmark returns are not covered by the report of the independent verifiers.
Frank Russell Company (“Russell”) is the source and owner of the trademarks, service marks and copyrights related to the Russell Indexes. Russell® is a trademark of Frank Russell Company. Neither Russell nor its licensors accept any liability for any errors or omissions in the Russell Indexes and / or Russell ratings or underlying data and no party may rely on any Russell Indexes and / or Russell ratings and / or underlying data contained in this communication. No further distribution of Russell Data is permitted without Russell’s express written consent. Russell does not promote, sponsor or endorse the content of this communication. “FTSE®”, “Russell®”, “FTSE Russell®” and all other trademarks and service marks used herein (whether registered or unregistered) are trademarks and/or service marks owned or licensed by the applicable member of LSEG or their respective licensors.
Forward P/E Ratio is determined by dividing the price of the stock by the company's forecasted earnings per share.
Free cash flow (FCF) represents the cash a company generates after cash outflows to support operations and maintain its capital assets. Unlike earnings or net income, free cash flow is a measure of profitability that excludes the non-cash expenses of the income statement and includes spending on equipment and assets as well as changes in working capital.
CapEx, or capital expenditures, are funds used by a company to acquire, upgrade, and maintain physical assets such as property, plants, buildings, technology, or equipment./sub>
A Capital Expenditures (CapEx) Ratio A Capital Expenditures (CapEx) Ratio