
Fast Reading
- Data can reveal portfolio risks that sector and geographic classifications may miss, including shared themes, types of value opportunity and reliance on particular sources of return.
- The way information is presented can influence investment decisions, so we design tools to focus attention on expected return, risk and changes in the investment case.
- Structured decision records can shorten the feedback loop, helping us test exceptions, compare outcomes and refine the process based on evidence rather than anecdote.
We aim to deliver modern, data-led and true-to-label value strategies
Our investment philosophy starts with a behavioural premise. Fear, greed and extrapolation can push market expectations too far in either direction, creating opportunities for investors willing to look beyond the prevailing narrative.
A data-led process helps us pursue those opportunities with greater precision.
We capture information systematically throughout research and portfolio construction. That allows us to see risks that conventional classifications may miss, shape the information we see when decisions are being made and build a record from which the process can learn.
Exhibit I. A data-led process to make value investing more deliberate
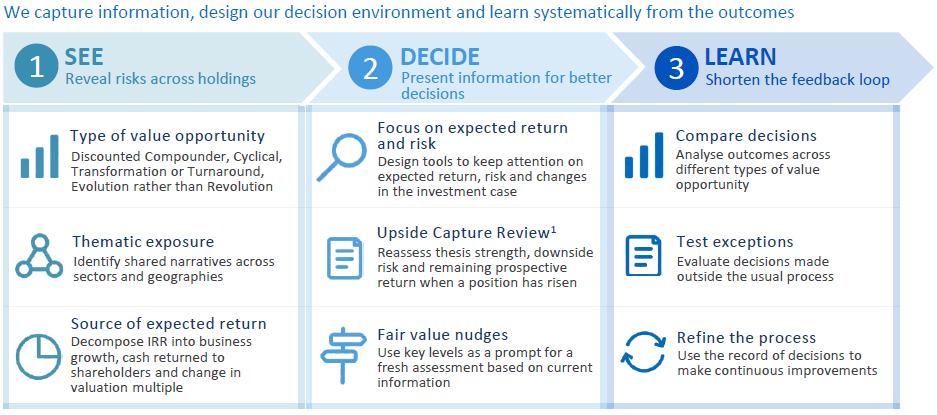
We capture information, design our decision environment and learn systematically from the outcomes.
Source: Brown Advisory.
Seeing the risks behind the holdings
Sector and geographic exposures provide a useful view of a portfolio. They can also leave important connections hidden. We tag holdings across additional dimensions to make those connections easier to see.
One is the type of value opportunity . Discounted compounders, thematic hysteria, turnarounds, cyclicals and “evolution, not revolution” situations each bring different risks and return profiles. Looking at those categories across the portfolio can reveal concentrations that are less obvious when each investment is considered on its own.
If a large proportion of capital depends on cycles, for example, we want that exposure to be visible. There may be periods when such a concentration is attractive. There are others where it is not. The data allow us to recognise it early and assess it deliberately.
Exhibit II. Value comes in different flavours 2
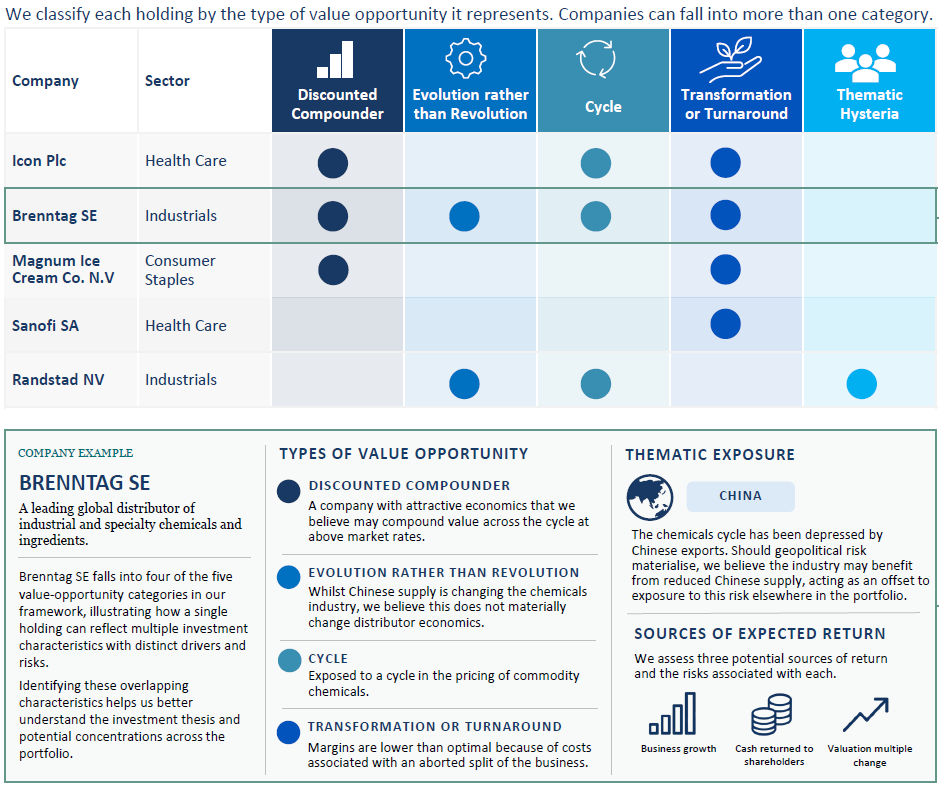
We classify each holding by the type of value opportunity it represents. Companies can fall into more than one category.
Source: FactSet and Brown Advisory analysis. For illustrative purposes only. Holdings shown were selected to illustrate the range of value characteristics within the portfolios and should not be viewed as a complete or representative sample of portfolio holdings. Portfolio information is based on the Brown Advisory International Value Select and Brown Advisory Global Value Select representative accounts as of 30/09/2026. Brenntag SE was selected on an objective basis because the investment team believes it demonstrates the investment philosophy of the Global Value Select Strategy and International Value Select Strategy. Brenntag SE does not represent all securities purchased, sold, or recommended for advisory clients. The value categories above are not based on GICS sectors, but on the ‘type of investment thesis’, as determined by Brown Advisory. Companies can fall into more than one category. Sectors are based on the Global Industry Classification Standard (GICS®) classification system.
We apply a similar approach to thematic exposure .
Themes can cut across sectors and geographies. A software company, a payments business and a professional-services firm may sit in different sectors while sharing exposure to the same narrative around artificial intelligence. On a conventional portfolio report, the positions may appear diversified. In practice, the positions may be exposed to the same underlying narrative and risks may be realised in the same scenario.
Tagging those exposures gives us another way to see how much of the portfolio may be influenced by the same market narrative.
A third lens looks at where expected returns come from.
For each investment, we decompose expected internal rate of return into three broad components: growth in the underlying business, cash returned to shareholders and change in the valuation multiple.
The mix can tell us something important about the character of the portfolio. Prospective returns driven primarily by business growth and cash generation look different from returns that rely heavily on a change in valuation.
Periods of exceptional fear can create attractive opportunities for multiple normalisation. At other times, a portfolio that depends heavily on rerating may leave less room for error. IRR decomposition allows us to see that reliance across the portfolio rather than only within individual stock models.
Capturing these attributes early gives us a more complete picture of the risks being assembled across the portfolio. Risk is inherent in investing and individual investment decisions will not always play out as expected. Understanding how those risks interact across the portfolio helps us take risk where we believe it is most mispriced, while building a diverse portfolio that is greater than the sum of its parts.
Designing better decisions
Data can do more than describe a portfolio. Whilst investors like to think they can be perfectly rational, the way information is organised can influence which signals receive attention and, in turn, how decisions are made. We use that deliberately, designing portfolio tools to present data in the way that we believe increases the chances of good decision making.
Losers are highly visible. Starting with that framing can encourage value investors to trim positions that have risen and add to those that have fallen, even though we know that momentum is a powerful effect in the market. We prefer to organise the decision around expected return and risk.
Our Upside Capture Review 1 is another example of that approach. A rising share price can create an instinct to trim, particularly for a value investor. The review redirects attention to thesis strength, downside risk and the prospective return that remains, rather than allowing the price move itself to drive the decision.
Fair value nudges 3 provides another natural decision point. We are reminded daily when a stock in the portfolio reaches our estimate of fair value. This encourages a fresh assessment of what remains available from the investment and makes it difficult to continue passively holding a successful position that we may have become attached to. Continuing to own the position should reflect the opportunity today, rather than simply the strength of the original thesis.
These tools are deliberately straightforward. Their usefulness comes from structuring the decision environment around the information we believe is most relevant to making a well-grounded decision.
Shortening the feedback loop
Investment outcomes take time to emerge and share prices provide an imperfect record of decision quality.
A sound investment decision can be followed by a poor outcome. A weak decision can benefit from a favourable environment. Five years of performance may still leave ambiguity around what worked, what did not and why.
Structured data give us ways to learn before the full investment outcome is known.
We can compare results across different types of value opportunity. We can examine whether certain trading decisions have added value over time. We can study what happens after a stock enters the research process through one of our screens. We can also look at the decisions we chose to make against the ones we could have left alone.
The same record allows us to test the exceptions we make to our own process.
Consider a rapidly falling share price accompanied by continued uncertainty around the fundamentals. We are generally cautious about adding aggressively in that situation, but occasionally, the prospective return may appear attractive enough to proceed.
Rather than treating each exception as a one-off judgement, we can examine them collectively. If overriding a warning has repeatedly produced poor outcomes, the evidence may support a stronger rule. If the results differ, we can look more closely at what separated the successful exceptions from the unsuccessful ones.
That creates a shorter path between experience and process development and means we can evolve based on evidence rather than anecdote.
For us, being data-led is ultimately about making judgement more deliberate. Data help us identify risks that are difficult to see through conventional portfolio lenses, put more useful information in front of investors when decisions are made and turn past decisions into evidence that can improve future ones.
Human behaviour remains the source of many of the opportunities we seek. Investment judgement remains central to deciding which are worth pursuing. The role of data is to make the judgements more evidence based, more testable and more capable of improving over time.
1. The upside capture review process is a rules-based behavioural tool and does not guarantee improved outcomes. Adding to rising positions may increase portfolio concentration and loss exposure. A stock remaining in the cheapest valuation tier may reflect persistent fundamental deterioration rather than a market mispricing. Past effectiveness of this approach is not indicative of future results.
2. Source: FactSet and Brown Advisory analysis. Portfolio information is based on the Brown Advisory International Value Select and Brown Advisory Global Value Select representative accounts as of 30/09/2026. The views expressed are those of Brown Advisory as of the date referenced and are subject to change at any time based on market or other conditions. The information provided in this material is not intended to be and should not be considered to be a recommendation or suggestion to engage in or refrain from a particular course of action or to make or hold a particular investment or pursue a particular investment strategy, including whether or not to buy, sell, or hold any of the securities mentioned. It should not be assumed that investments in such securities have been or will be profitable. References to specific securities are for illustrative purposes only and do not represent all of the securities purchased, sold or recommended for advisory clients. Past performance is not a guarantee of future performance. Please see the end of this presentation for important disclosures and a complete list of terms and definitions.
3. Fair value estimates are subjective and may differ from realized outcomes. Decisions informed by Fair Value Nudges may result in selling investments that subsequently appreciate, and use of the tool does not guarantee improved investment results.
Disclosures
All investments involve risk, including possible loss of principal. Please see each product’s web page for specific details regarding investment objective, risks, performance, and other important information. Review this information carefully before you make any investment decision.
The views expressed are those of the author and Brown Advisory as of the date referenced and are subject to change at any time based on market or other conditions. These views are not intended to be and should not be relied upon as investment advice and are not intended to be a forecast of future events or a guarantee of future results.
Past performance is not a guarantee of future performance, and you may not get back the amount invested.
The information provided in this material is not intended to be and should not be considered to be a recommendation or suggestion to engage in or refrain from a particular course of action or to make or hold a particular investment or pursue a particular investment strategy, including whether or not to buy, sell or hold any of the securities mentioned. It should not be assumed that investments in such securities have been or will be profitable. To the extent that specific securities are mentioned, they have been selected by the author on an objective basis to illustrate views expressed in the commentary and do not represent all of the securities purchased, sold or recommended for advisory clients. This material is intended solely for our clients and prospective clients, is for information purposes only and is not individually tailored for or directed to any particular client or prospective client.
The information contained herein has been prepared from sources believed reliable but is not guaranteed by us as to its timeliness or accuracy and is not a complete summary or statement of all available data. The information in this document has not been independently reviewed or audited by outside certified public accountants. The information provided is not intended to be a forecast of future events or a guarantee of future results. Past performance is not indicative of future performance.
FactSet® is a registered trademark of FactSet Research Systems, Inc.
Standard & Poor’s, S&P®, and S&P500® are registered trademarks of Standard & Poor’s Financial Services LLC (“S&P”), a subsidiary of S&P Global Inc.
Global Industry Classification Standard (GICS®) and “GICS” is a trademark of Standard & Poor’s Financial Services LLC and MSCI Inc.
Terms and Definitions:
The internal rate of return (IRR) is a measure of an investment’s rate of return. The internal rate of return is a discount rate that makes the net present value(NPV) of all cash flows from a particular project equal to zero. It is also called the discounted cash flow rate of return.