
To mark the third year of the Brown Advisory Large-Cap Sustainable Value strategy, Portfolio Manager Mike Poggi, CFA alongside Financials Equity Research Analyst Cam Mathis, marked this major milestone by reflecting on his definition of value investing and how this is embedded in the strategy’s investment approach. In a live webinar, they discussed why staying true to their investment philosophy has helped them navigate the challenging market environment of the past three years and highlight key learnings.
The webinar can be replayed below and is followed by a brief write-up. For more information on our Large-Cap Sustainable Value strategy, please visit the strategy webpage or contact us.1,2
3Source: https://www.youtube.com/watch?v=CeyUDhogTWs
Sustainability and value investing have not always been seen as natural bedfellows. Historically, most sustainable strategies have focused on the high-growth areas of the market – the remit of innovation and disruption, as well as high multiples and high expectations.
Yet, three years ago, the team behind the Large-Cap Sustainable Value strategy observed a compelling opportunity at the intersection of value investing and sustainable investment research. They believed that sustainable business practices were not exclusive to one corner of the market; in fact, the research identified numerous companies in the value universe that were leveraging best-in-class operational and governance standards to improve their long-term performance.
To capitalize on this opportunity, the Large-Cap Sustainable Value strategy was launched in September 2022, applying a targeted, research-intensive approach designed to uncover attractive investments that meet a disciplined sustainable and value criteria.
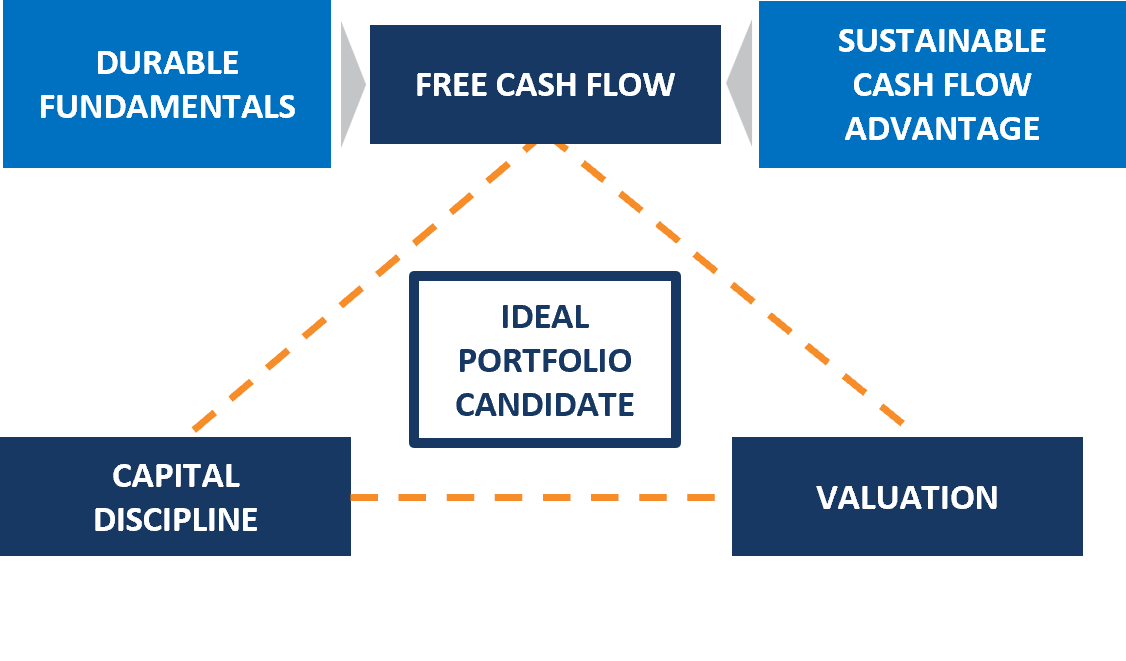
Value = quality, at the right price
Although the Large-Cap Sustainable Value strategy is still relatively young, Brown Advisory has been investing in the value space for over 15 years. And over that time, our definition of value has not altered. To us, value investing goes beyond identifying companies with low absolute valuation multiples. It reflects a disciplined focus on quality. Instead, we aim to upgrade our portfolio by seeking high-quality businesses at the right price, which can then compound over time.
In our view, quality value can be identified through three pillars. This process starts with free cash flow – our north star. From a fundamental standpoint, we look for proven business models that can withstand different economic cycles. We favor self-funding, capital light business models where a high percentage of EBITDA can be converted into free cash flow year in and year out. We also consider free cash flow through a sustainability lens. These are companies that are leveraging best-in-class sustainable business practices to further enhance an already attractive free cash flow stream.
Secondly, we pay close attention to a company’s capital discipline. We want the companies in our portfolio to maintain prudent capital structures and place value on financial flexibility – this approach keeps us away from highly leveraged companies. Finally, as value investors, we naturally seek companies with attractive valuations. We find that these three elements form a margin of safety and downside protection.
Chart 1: Three pillar value philosophy4
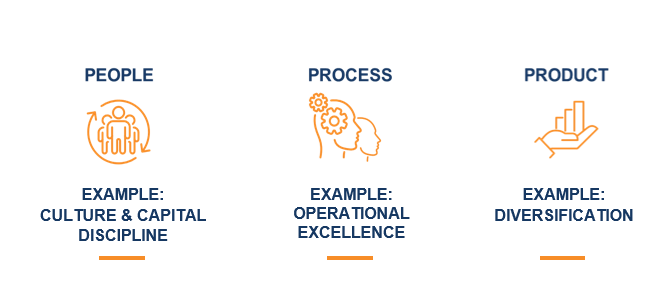
A focus on continuous improvement
To complement these three pillars, we apply an investment filter that covers the 3Ps: People, Process and Product. Any business is going to be subject to outside forces – be that interest rate changes, trade wars or pandemics – factors that management teams have little influence or control over. However, there are three specific areas that businesses can control: the people they hire and the culture they foster; their business process; and the product (or service) they deliver. We prize management teams that focus on controlling the controllable rather than being distracted by external noise.
In terms of analysis, it’s really quite simple. A happy workforce tends to serve its customers better. Companies with operational excellence are better positioned to run effective and adaptive organizations. And companies that are leaning into sustainability and innovation are providing products and services that their customers truly value. These elements can also be summed up as continuous improvement, which is good for business and, consequently, good for us as shareholders.
Chart 2: 3 P investment filter5
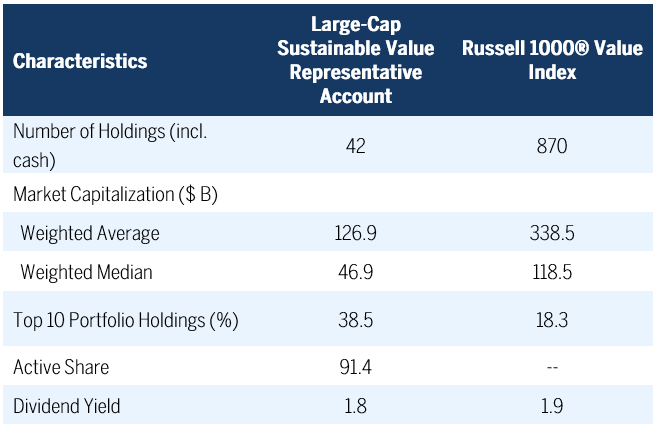
Differentiated universe, concentrated portfolio
Concentration is the cornerstone of equity investing at Brown Advisory. The Large-Cap Sustainable Value strategy has typically retained a portfolio of between 35 and 45 names since inception; however, we are fishing in a much larger pool. The strategy may be benchmarked against the 870 companies included in the Russell 1000® Value Index, but we cast our net well beyond these parameters.
Our bottom-up process creates a high bar, filtering down a thousand potential companies to create a concentrated pipeline of unique and differentiated ideas. Like the growth side of the market, the higher market cap names have also been leading performance in recent years, but we are finding more interesting opportunities further down the market cap spectrum. This determination to differentiate our portfolio from its benchmark, and willingness to put capital behind our highest conviction ideas, is borne out by our high active share and underlines our philosophy that beating a benchmark over time requires your portfolio to be different.
Chart 3: Portfolio Attributes as of 09/30/20256
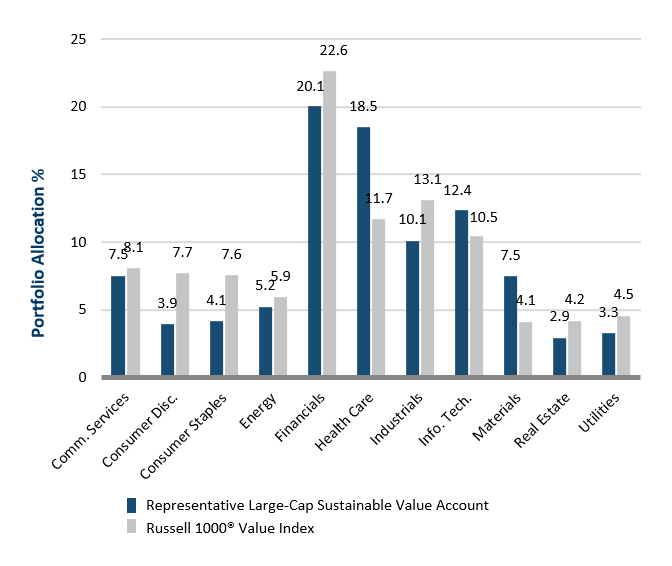
A lack of benchmark constraints is also exhibited through our sector allocation, where there are no limits on underweights or overweights. While the portfolio is fairly balanced across different economic sectors, there are notable underweights around consumption. In our view, businesses within the consumer staples and discretionary sectors are being forced to absorb a lot of inflation right now, as well as those that are most impacted by tariffs, and we are consequently finding few ideas in these areas.
Conversely, the portfolio holds a sizeable overweight to the Health Care sector. This is an area that has been plagued by enormous apathy for some time, even though there have been and remain strong economic drivers supporting these businesses. As a result, we are finding high-quality companies trading around 10-year valuation lows. As well as being compelling businesses that align with our three pillars and 3P criteria, the entry price also matters when investing. With high multiples come high expectations, whereas a low valuation provides an additional margin of safety and downside protection.
Chart 4: Portfolio Diversification as of 09/30/2025 7
Case Study: KKR & Co.
KKR – a leading global investment firm – is a prime example of our principle of buying quality at the right price, which then compounds over time. It also neatly illustrates our perspective that quality financial stocks don’t just have to be banks or insurers but can come from a much broader subset that also includes capital markets, financial technology and payment services.
Brown Advisory has held KKR within various strategies since 2018, and it has maintained a place in the Large-Cap Sustainable Value portfolio since its launch. Such a company might be expected to have a cyclical free cash flow stream, but KKR’s business model is actually quite differentiated from its peers. Having started as a traditional private equity business, KKR has grown its franchise to encompass more perpetual capital vehicles, recurring revenue businesses, as well as real estate platforms. This shift has diversified its free cash flow, so that it is less cyclical and less volatile
From a capital allocation standpoint, there is a strong history of dividends and buybacks, but there is also a strong ethos of employee ownership that goes beyond management and aligns the workforce with its shareholders. The company’s ownership model flows down throughout the entire organization and has created a USD 20 billion wealth pot for its employees. A financial literacy program has reinforced the appreciation of employee ownership and encouraged further wealth building. Finally, following the market sell-off in 2022, the portfolio was able to initiate its position in KKR at a substantial discount, which ticked the valuation box. From this point, this quality company has delivered significant growth in its earnings-free cash flow and has benefited from a sizeable valuation expansion.
Lessons Learned
The only real constant in the world of investment is change; therefore, the main lesson from the first three years is to never stop learning. As a team, we are rigorous and active in our approach in order to maintain a strong pipeline of fresh ideas. Although we manage a low-turnover, concentrated portfolio, there should always be competition from new prospects. We are careful to keep an open mind and not to dismiss ideas that may not fit our criteria currently, but which may offer value in the coming months or years. In this way, we aim to keep our finger on the pulse of economic, market and business trends.
This is particularly relevant for the current market environment. As the spread between the growth and the value parts of the market continues to widen, and with many investors focusing solely on a narrow subset of that market, inefficiencies will naturally emerge. At the headline level, US equities may appear expensive, but we are finding quality companies with high free cash flow yields at decade-low valuations. We believe such compelling value opportunities should provide a good degree of downside protection during periods of volatility. And, in our view, one of the best ways of growing capital over time is to avoid large drawdowns. This is why we believe it is so vital to stay true to our value approach. By only investing in the companies that meet our value criteria, we can control those controllables in an uncertain world.
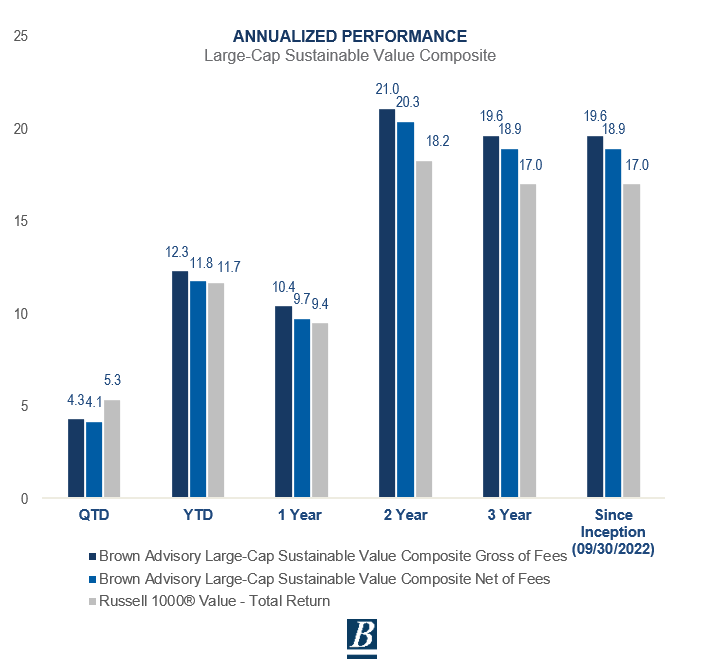
Chart 6: Strategy Composite Performance
1Source:https://www.brownadvisory.com/us/strategies/large-cap-sustainable-value…
2Source:https://www.brownadvisory.com/contact-us
3Source: https://www.youtube.com/watch?v=CeyUDhogTWs
4Source: Brown Advisory
5Source: Brown Advisory
6Source: FactSet. Portfolio information is based on a representative Large-Cap Sustainable Value account and is provided as Supplemental Information. Portfolio characteristics exclude cash and cash equivalents. Top 10 portfolio holdings include cash and equivalents which was 4.5% as of 09/30/2025. Ex. Financials excludes Banks and Insurances Companies and outliers excluded from the benchmark. Please see the GIPS Report on the last page for additional information.
7Source: FactSet. Portfolio information is based on a representative Large-Cap Sustainable Value account and is provided as Supplemental Information. Sectors are based on the Global Industry Classification Standard (GICS) classification system. Sector weights include cash and cash equivalents. Please see the GIPS Report on the last page for additional information.
8Source: FactSet. Data as of 09/30/2025 The information provided in this material is not intended to be and should not be considered to be a recommendation or suggestion to engage in or refrain from a particular course of action or to make or hold a particular investment or pursue a particular investment strategy, including whether or not to buy, sell, or hold any of the securities mentioned. It should not be assumed that investments in such securities have been or will be profitable. References to specific securities are for illustrative purposes only and do not represent all of the securities purchased, sold or recommended for advisory clients.
9Source: KKR company reports, and Brown Advisory analysis. KKR is a current holding in the Large-Cap Sustainable Value portfolio representative account as of 09/30/2025 and was selected because the investment team believes it demonstrates the strategy’s stated investment philosophy; It does not represent all of the securities purchased, sold or recommended for advisory clients. Portfolio information is based on a representative Large-Cap Sustainable Value account and is provided as Supplemental Information. Please see the GIPS Report on the last page for additional information.
Disclosures
The views expressed are those of the author and Brown Advisory as of the date referenced and are subject to change at any time based on market or other conditions. These views are not intended to be and should not be relied upon as investment advice and are not intended to be a forecast of future events or a guarantee of future results. The information provided in this material is not intended to be and should not be considered to be a recommendation or suggestion to engage in or refrain from a particular course of action or to make or hold a particular investment or pursue a particular investment strategy, including whether or not to buy, sell, or hold any of the securities mentioned. It should not be assumed that investments in such securities have been or will be profitable. To the extent specific securities are mentioned, they have been selected by the author on an objective basis to illustrate views expressed in the commentary and do not represent all of the securities purchased, sold or recommended for advisory clients. The information contained herein has been prepared from sources believed reliable but is not guaranteed by us as to its timeliness or accuracy, and is not a complete summary or statement of all available data. This piece is intended solely for our clients and prospective clients, is for informational purposes only, and is not individually tailored for or directed to any particular client or prospective client.
TAll investments involve risk. The value of the investment and the income from it will vary. There is no guarantee that the initial investment will be returned.
Sustainable investment considerations are one of multiple informational inputs into the investment process, alongside data on traditional financial factors, and so are not the sole driver of decision-making. Sustainable investment analysis may not be performed for every holding in the strategy. Sustainable investment considerations that are material will vary by investment style, sector/industry, market trends and client objectives. The Large-Cap Sustainable Value Strategy (“Strategy”) seeks to identify companies that it believes may be desirable based on our analysis of sustainable investment related risks and opportunities, but investors may differ in their views. As a result, the Strategy may invest in companies that do not reflect the beliefs and values of any particular investor. The Strategy may also invest in companies that would otherwise be excluded from other funds that focus on sustainable investment risks. Security selection will be impacted by the combined focus on sustainable investment research assessments and fundamental research assessments including the return forecasts. The Strategy incorporates data from third parties in its research process but does not make investment decisions based on third-party data alone.
All financial statistics and ratios are calculated using information from FactSet® as of the report date unless otherwise noted. FactSet® is a registered trademark of FactSet Research Systems, Inc. The Global Industry Classification Standard (GICS) was developed by and is the exclusive property of MSCI and Standard & Poor’s. “Global Industry Classification Standard (GICS), “GICS” and “GICS Direct” are service marks of Standard & Poor’s and MSCI . “GICS” is a trademark of MSCI and Standard & Poor’s.
An investor cannot invest directly into an index
The Russell 1000® Value Index measures the performance of the large-cap value segment of the U.S. equity universe. It includes those Russell 1000 companies with lower price-to-book ratios and lower expected and historical growth rates. The Russell 1000® Value Index is constructed to provide a comprehensive and unbiased barometer for the large-cap value segment. The Index is completely reconstituted annually to ensure new and growing equities are included and that the represented companies continue to reflect value characteristics. The Russell 1000® Value Index and Russell® are trademarks/service marks of the London Stock Exchange Group companies. An investor cannot invest directly into an index. Benchmark returns are not covered by the report of the independent verifiers.
Frank Russell Company (“Russell”) is the source and owner of the trademarks, service marks and copyrights related to the Russell Indexes. Russell® is a trademark of Frank Russell Company. Neither Russell nor its licensors accept any liability for any errors or omissions in the Russell Indexes and / or Russell ratings or underlying data and no party may rely on any Russell Indexes and / or Russell ratings and / or underlying data contained in this communication. No further distribution of Russell Data is permitted without Russell’s express written consent. Russell does not promote, sponsor or endorse the content of this communication.
As of September 30, 2025, Brown Advisory had approximately $174.5 billion in client assets managed on a discretionary, non-discretionary and model delivery basis across the following affiliated entities: Brown Advisory LLC, Brown Investment Advisory & Trust Company, Brown Advisory Ltd., Brown Advisory Trust Company of Delaware, LLC, Brown Advisory Investment Solutions Group LLC, NextGen Venture Partners LLC and Signature Financial Management, Inc.
As of September 30, 2025, firmwide institutional strategies had approximately $71.9 billion in assets under management in institutionally marketed strategies. Strategy Assets includes assets under discretionary management and non-discretionary assets under management. Equity strategy assets include Large-Cap Sustainable Growth, Large-Cap Growth, Large Cap Sustainable Value, Sustainable Small-Cap Core, Mid-Cap Growth, Small-Cap Growth, Flexible Equity, Small-Cap Fundamental Value, Global Leaders, Global Leaders Large-Cap, Sustainable International Leaders, Sustainable International Leaders EAFE, Global Focus and Custom Solutions strategies. Fixed Income strategy assets include the Sustainable Core Fixed Income, Global Sustainable Total Return Bond, Enhanced Cash, Intermediate Income, Limited Duration, Sustainable Short Duration, Municipal Bond and Tax-Exempt Sustainable strategies. Global Leaders strategy listed assets include Global Concentrated Equity.
Dividend Yield is the ratio of a stock’s projected annual dividend payment per share for the fiscal year currently in progress, divided by the stock’s price. Portfolio-level statistic equals the weighted average of the ratios of all holdings in the portfolio. Free Cash Flow (FCF) represents the cash a company generates after accounting for cash outflows to support operations and maintain its capital assets. FCF yield is a measure of financial performance calculated as operating cash flow minus capital expenditures. FCF yield calculations presented use NTM and exclude Banks and Insurance companies. Enterprise Value (EV) to Free Cash Flow (FCF) (EV/FCF) compares company valuation with its potential to create positive cash flow statements. Here EV represents the total market value of a company's share price times the number of shares outstanding, also referred to as market cap, plus debt, minus cash. Market Capitalization refers to the aggregate value of a company’s publicly-traded stock. Statistics are calculated as follows: Weighted Average: the average of each holding’s market cap, weighted by its relative position size in the portfolio (in such a weighting scheme, larger positions have a greater influence on the calculation); Weighted Median: the value at which half the portfolio's market capitalization weight falls above and half falls below; Maximum and Minimum: the market caps of the largest and smallest companies, respectively, in the portfolio. Dividend Yield is the ratio of a stock’s projected annual dividend payment per share for the fiscal year currently in progress, divided by the stock’s price. Active Share indicates how different the portfolio is from its benchmark. Calculated as the sum of each security's absolute weight difference. The Net Debt/ EBITDA (earnings before interest depreciation and amortization) ratio is a measurement of leverage, calculated as a company's interest-bearing liabilities minus cash or cash equivalents, divided by its EBITDA. The calculation presented exclude Banks and Insurance companies. Earnings Per Share (EPS) is a measure of profitability based on a company's net income.