
Fast Reading
- 2025 was characterized by a surprisingly resilient economy despite rising geopolitical tensions and US policy uncertainty. Geopolitics continues to take center stage in early 2026, most recently with the start of the U.S./Israeli-led conflict in Iran.
- While it is understandable that much attention is paid to the headlines surrounding these evolving geopolitical events, we believe it is important to not lose sight of some of the underlying structural trends reshaping the global economy that may not get as much air time.
- We believe that there are a number of key themes – many of which are interconnected – that can help us better identify hidden pockets of risk and opportunity that may not yet be fully priced into the markets.
Inequality & Affordability
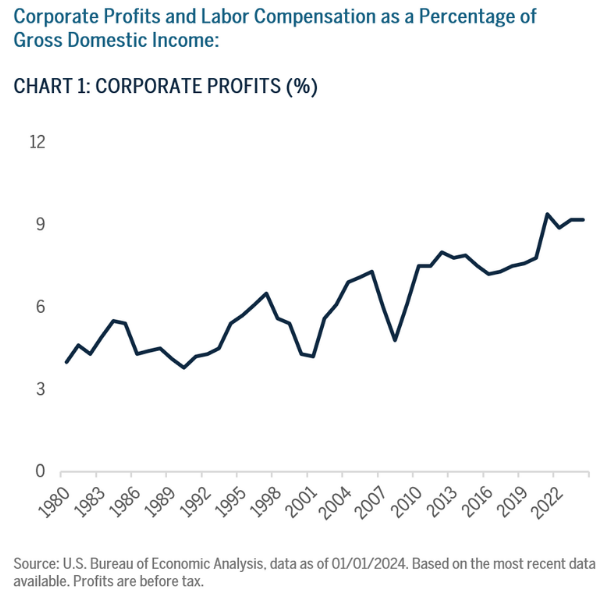
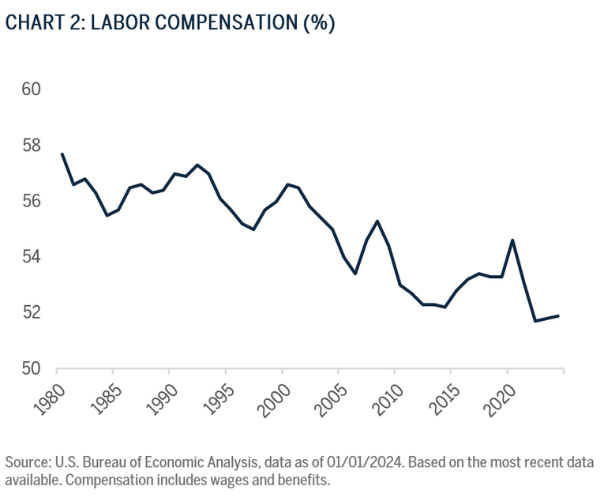
Rising income and wealth inequality in the U.S. contribute to uneven growth in an increasingly K-shaped economy, with the top 10% of earners making up nearly half of all consumer spending.1 At the same time, labor’s share of GDP hit the lowest level since the Bureau of Labor Statistics started recording this data in 1947, a trend only likely to continue with the AI boom. This year we also expect tariffs to put further pressure on lower-income households, which will likely exacerbate this trend, only partially offset by above-average tax refunds in the first half of the year.2
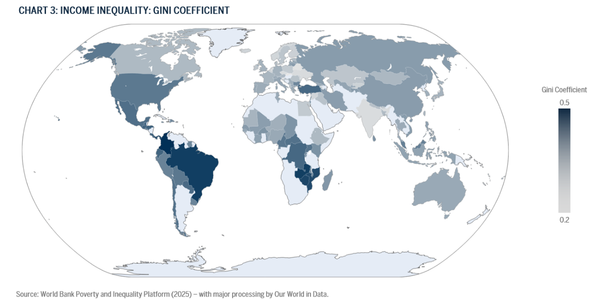
This growing divide means the U.S. economy will likely have higher sensitivities to asset prices (equities, homes) and may be more susceptible to a longer, deeper recession if AI-led growth does not play out. Longer term, the World Bank estimates that a 1% increase in income inequality (as measured by the Gini coefficient), is associated with a 1% decline in GDP growth over a five-year period.3
Inequality also tends to correlate with more populist movements, driven by general discontent with the economy and lack of affordability. This raises the risk of more frequent and severe bouts of civil unrest. In the case of AI specifically, we are starting to see a growing populist AI backlash stemming from increased resource constraints (as discussed later under AI Infrastructure & Resource Scarcity), as well as fears of labor force displacement or misuse of the technology. Prominent Republicans are starting to break with the Trump Administration on this issue, highlighting that this is a bipartisan movement that is only likely to gain steam ahead of the U.S. midterm elections in the second half of the year.
On the flip side, although inequality has worsened within the U.S., global inequality (i.e., inequality between countries) has continued to improve with the ratio of consumption spending between the world’s richest 10% and the poorest 50% more than halving since 2000.4 This is driven mostly by gains in emerging market countries. This, coupled with our expectation of a weaker dollar, suggests further opportunities to lean into emerging markets (EM) as a result of increased purchasing power.
Demographics, Migration, and the AI Productivity Miracle?
We are approaching a “demographic cliff” in many advanced economies where aging populations are outpacing new entrants into the labor force. At the same time, more restrictive immigration policies and declining labor force participation from certain groups contribute to further shrinking of the labor supply, weighing on future GDP growth potential and increasing fiscal deficits. While AI has the potential to fill this gap, the effect will vary across sectors, potentially leading to a skills mismatch in the near-term.
Immigration Policy
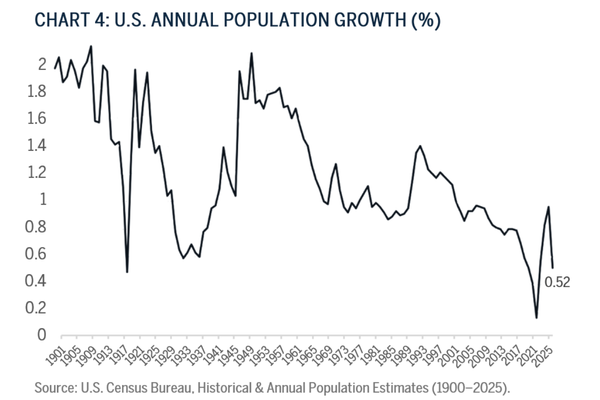
While not a uniquely U.S. phenomenon, the U.S. serves as an important case study for understanding the economic and fiscal impacts of immigration. As birth rates have declined, immigrants have made up ~80% of U.S. population growth since 20205 and today make up roughly 19% of the labor force. 6 It is no surprise then that the U.S. population growth rate was 0.52% last year, the lowest level with the exception of 2020-2021 (COVID-19), since the nation’s founding. 7 Several studies have looked into the economic impacts of this reduction in net immigrants, highlighting modest downward pressure on consumer spending and GDP growth, as well as a recalibration of the labor market.
While the headlines are often focused on illegal immigrants, an estimated 230,000 people were deported in all of 2025, just a fraction of the ~1.5 million reduction in net immigration last year. 8 This suggests that a potential “brain drain” effect is taking place with new restrictions on visas and people simply opting not to come to the U.S. As a result of the smaller labor force, estimates for breakeven monthly employment growth in 2026 range from 50,000 new jobs to potentially even -20,000 jobs; down from roughly 100,000 in years prior. 9
Looking at the sector-level impacts is also illuminating. Healthcare and social services made up the bulk of new job creation last year – much of these jobs specifically geared towards helping the aging population, such as home health aides, 39% of whom are immigrants.10 Another sector at risk is construction, where labor is a constraint to the data center buildout (as discussed under AI Infrastructure & Resource Scarcity). Both of these jobs are unlikely to be automated by AI anytime soon, which speaks to the skills mismatch we are likely to see in the near-term. This skills mismatch may put upward pressure on wages, contributing to inflation.
The last piece to highlight on immigration is the potential to worsen the U.S. fiscal deficit. The Cato Institute released a study showing that immigrants pay 14% of tax revenues yet consume just 7% of public benefits. Further, without the contribution of immigrants over the last 30 years, public debt/GDP would be over 200%.11
Beyond the U.S., anti-immigrant sentiment and the rise of far-right governments has taken hold in many other countries around the world, something we have been closely watching particularly in the EU and Latin America. It is worth noting that much of this sentiment is driven by inequality and affordability concerns, highlighting the interconnectedness of these themes. One outlier to this is Spain, where immigration has been an important driver of recent growth – and increasingly that growth has shifted towards more educated workers serving the higher value-add services sector.12
Female Labor Force Participation
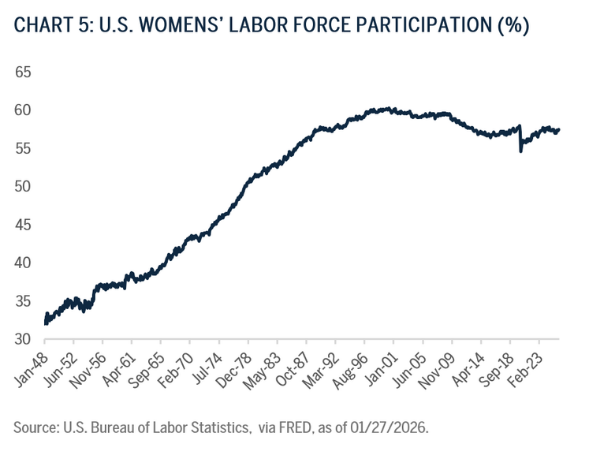
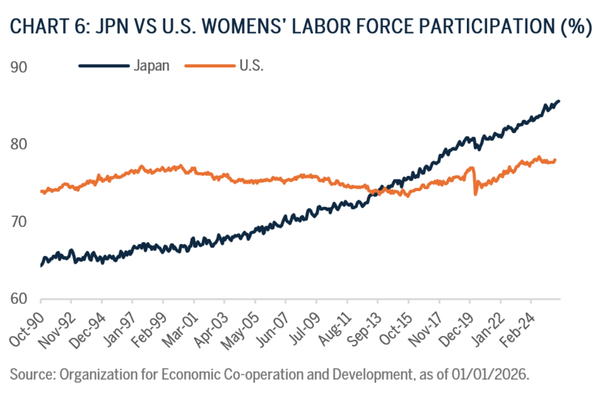
Another underappreciated factor contributing to a further reduction in the U.S. labor supply is a declining female labor force participation rate. The U.S. is the only advanced economy with a declining female labor force participation rate over the last 20 years – a trend that started to reverse during the COVID-19 pandemic with more flexible work options, but has since started to decline. Over half a million women left the labor force last year, with high childcare costs and lack of workplace support as the key drivers.13 Increasing female labor force participation has been found to be an important tool in combating the declining demographic trends and unleashing greater growth potential with the World Bank estimating a boost of 20% in global GDP if we were to close the gender labor gap.14 Japan is a good example of how intentional policies to bring more females into the workforce can be an important driver for the economy.
AI Productivity Miracle?
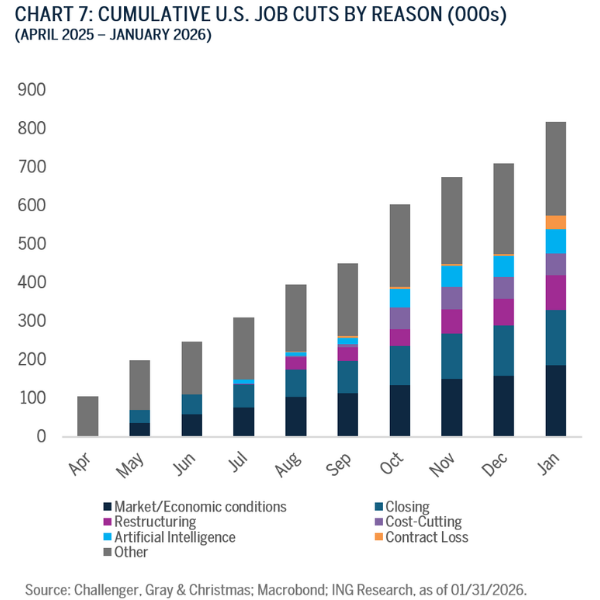
Now that we have discussed the factors pointing to reduced labor supply, the big question becomes: Can the boost in productivity from AI make up for these losses? Capital Economics currently estimates that AI is contributing 0.5% to productivity growth and that it will rise to around 2% per annum through the 2030s.15 However, the results are sector-specific with ICT (information, communications, technology) making up the bulk of those gains. Despite CEOs touting the benefits of AI on earnings calls, we also see that AI is still only responsible for ~10% of recent job cuts16 and that there is a disconnect between how much time C-suite executives vs the average worker think that they are saving by using AI.17 Understanding the impact of AI on productivity gains will be impactful in determining how quickly the Fed moves to cut rates; i.e. If AI productivity takes off and leads to non-inflationary growth, this could lead to the Fed cutting rates sooner.
AI Infrastructure & Resource Scarcity
That brings us to another key question for the Fed: Will AI be inflationary before the productivity gains are realized (leading to rising rates and a higher neutral rate)? With so much of the U.S. economy’s growth hinging on AI this year, it is important to understand the risks that could hinder such lofty growth expectations. Resource scarcity in the form of energy, water, and labor are likely to be exacerbated by the data center buildout, contributing to inflation and increasing community opposition – which in turn could lead project cancellations/ delays, and displace investment in other parts of the economy. An estimated ~$100bn of data center projects had been cancelled/delayed as of 2Q202518, and already in 2026, we have seen a 56% MoM increase of data center project cancellations or postponements.19 While still just a drop in the bucket of the $650 billion in planned investments this year and hyperscalers are quickly working to address these bottlenecks (as our tech equity research analysts cover in The Data Center Balancing Act: Powering Sustainable AI Growth), it remains a key area to watch in the coming year. It is also important to note that while the focus is largely on the U.S., nearly 60% of the 1,244 largest data centers in the world were outside the U.S. as of June 2025 and we have seen disruptions across geographies, creating a significant challenge for countries hoping to reap the economic benefits of AI too.20
Energy
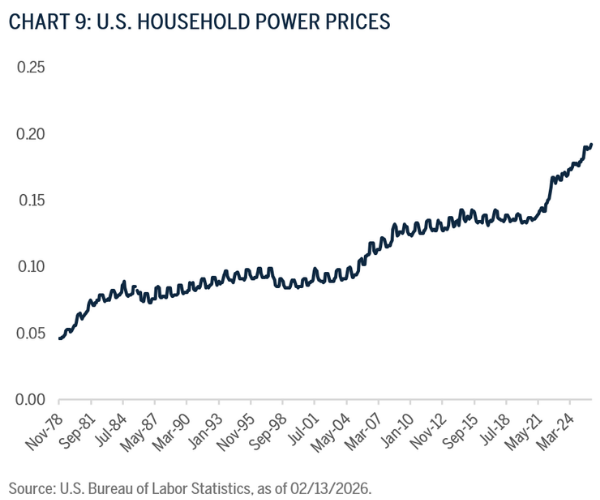
Projections for new power demand as a result of the AI/data center buildout vary quite a bit, but the general consensus is that it will dramatically increase global electricity consumption, placing additional strain on the already aging grid infrastructure – in the U.S. and beyond. This is likely to continue to be inflationary as we saw electricity prices in the U.S. jump 6.9% in 2025, twice the headline inflation rate of 2.9%, with expectations for a further 6% increase this year.21
Furthermore, pullbacks to the IRA and tariffs on China have handicapped the renewables sector at a time where an “all of the above” approach to energy is needed (something also highlighted under Geopolitics: the Climate, Security & Competitiveness Trilemma). To combat this reliance on China, there could be potential opportunities in critical minerals as several countries have continued to invest in new critical minerals exploration and development, including Canada, Australia, U.S., and Chile.22
Water
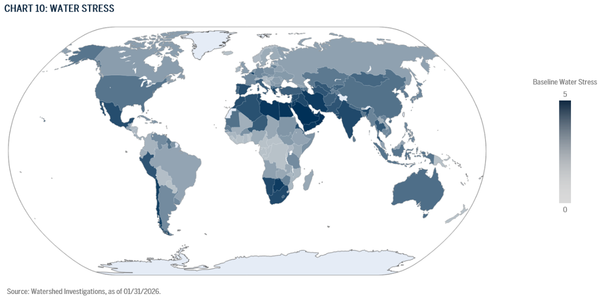
Water scarcity is also likely to be exacerbated by data center usage during a time where water is increasingly becoming a national security threat and a source of greater conflict. 43% of existing data centers are already located in regions of high water stress. In China and the U.S., about 60% and 38% of assets, respectively, are projected to be exposed to high water stress this decade.23 Water risk can be both local, as we have seen with community opposition to data centers, as well as cross-border. Two-thirds of freshwater resources cross national borders, yet three-fifths lack a framework to resolve disputes.24 It has even come up as a bargaining chip in the USMCA renegotiations as the U.S. has ramped up pressure to increase water deliveries to border states.
Labor
Lastly, already tight labor supply may lead to increased costs, project delays and cancellations, and displacement of construction in other areas. The Associated Builders & Contractors notes that they will need to attract 349,000 new workers in 2026, the vast majority going towards data centers. Spending on construction of new data centers rose 32% in 2025 through October compared with the same 10 months of 2024, while barely growing or declining in other sectors.25 This labor shortage is likely to shift resources from other areas – namely housing – thereby exacerbating housing affordability issues (getting back to Inequality & Affordability), and is only likely to be made worse by the restrictive immigration policy (noted above under Demographics, Migration & the AI Productivity Miracle?).
Geopolitics: The Climate, Security, & Competitiveness Trilemma
As new geopolitical risks have emerged, policy and government spending priorities have justifiably shifted towards matters of security. However, just as the EU learned with regards to economic competitiveness, climate should be embedded into policy rather than viewed in a silo, recognizing climate as a force multiplier. Balancing near-term policy volatility with longer-term realities will be important. This is particularly true with the current conflict in Iran. While no one knows how long the conflict will last, it is an important reminder that prioritizing energy security and reducing dependence on fossil fuels can be an important mitigant in responding to energy shocks.
From a policy perspective, we expect to see more pragmatic climate policies, ones that are more strategic and integrated into broader industrial policy and economic objectives. We are seeing this in the EU with regards to evolving policy developments (CBAM, EU ETS, EUDR) that on the surface may seem like a step backwards, but in reality, are prioritizing resources in a way that should allow their economies to be more resilient over the long-term.26 Canada similarly made changes to its carbon pricing system last year to lower the impact on consumers, reflecting this more pragmatic approach. Japan has also emerged as an example of what a more fully integrated industrial policy could look like with its GX (Green Transformation) Industrial Policy, which plays to their unique geographic and economic advantages. There will be no one-size-fits-all approach to climate policy, but we expect to see more carrots and less sticks, aligning incentives with the private sector and overarching economic and security objectives.
Going further to the extreme, we do note that the U.S. pulling back on incentives from the Inflation Reduction Act (IRA) and removal of greenhouse gas emission regulation by the Environmental Protection Agency (EPA) may have longer term implications. While an “all of the above” approach to energy is needed (as discussed under AI Infrastructure & Resource Scarcity), delays in investing in next generation technologies while doubling down on fossil fuel investment, may risk ceding competitiveness and soft-power to China. As noted in the Eurasia Group’s 2026 Global Risk report, “Washington is asking the world to buy 20th-century energy while Beijing offers 21st-century infrastructure.” 27 Localizing supply chains and labor is likely to be inflationary in the near-term but is important for ensuring longer-term energy security in renewables and other clean technologies.
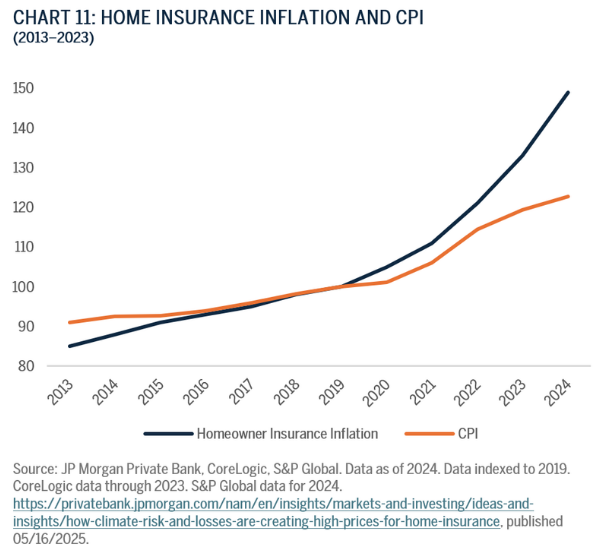
Lastly, despite what policymakers do, nature will continue to run its course. Global economic losses from natural disasters in 2025 was $224 billion, $108 billion of which were insured losses, according to Munich Re. While lower total losses compared to 2024, we continue to see >$100 billion insured losses becoming the new normal, mostly attributed to wildfires, floods, and severe thunderstorms.28 The increasing number and severity of climate-related events contribute to inflation and affordability concerns in the form of rising insurance premiums and food prices. Rising home insurance premiums have significantly outpaced CPI, as insurance companies price in climate risk. Between 2019 and 2023 CPI rose about 23% compared to 49% for home insurance inflation, according to a JP Morgan study (Chart 11).29 Additionally, natural disasters put greater strain on fiscal deficits as governments step in to respond. In response to flooding and wildfires, 17% of Spain’s increased 2025 military spending was devoted to the management of emergencies and natural disasters – again highlighting the interconnected nature of climate, security, and competitiveness.30
U.S. Institutional Strength on Watch
Lastly, we cannot talk about the evolving geopolitical landscape without mentioning the role U.S. policy and diplomacy has played in the evolving world order. Deterioration in U.S. institutional strength and continued trade policy uncertainty weaken its standing in the global world order and financial markets, particularly as it relates to being the world’s reserve currency. We have already seen several large institutions pull or lower their U.S. Treasury allocations. While policies come and go, it is the threats to institutions that diminish U.S. credibility and competitiveness and contribute to our expectation of a weaker dollar and a higher term premium.
We do see that the U.S. system of checks and balances is still working in many ways. More than 600 lawsuits against the Trump administration are making their way through the courts – most recently, the Supreme Court ruling to strike down the sweeping use of tariffs suggests the judicial system is still functioning as intended.31 Additionally, we are seeing state governments play a more active role on key issues (climate, AI, immigration), and so far, the Fed has been able to withstand threats against its independence. With the midterm elections coming up at the end of the year, we will be acutely focused on matters related to freedom of speech, election interference, and rising corruption – factors that may sway the election result or could indicate more permanent deterioration to U.S. institutions and respect for the rule of law that may be harder to come back from.
Conclusion
While we will not claim to know how any of these themes will play out with any degree of certainty, we believe that these will be key areas to watch in 2026 and beyond. These themes also highlight the importance of our top-down and bottom-up research process as we seek to identify alternative data points and signals that can help us to better understand impacts to employment, inflation and growth that may not be explicitly captured in traditional macroeconomic analysis, but will nonetheless reshape the global economy and the resulting monetary and fiscal policy.
1 Ensign, Rachel Louise. The U.S. Economy Depends More Than Ever on Rich People, https://www.wsj.com/economy/consumers/us-economy-strength-rich-spending-2c34a571, published on 02/23/2025.
2 Tax Foundation, Tax Refunds and the One Big Beautiful Bill Act, https://taxfoundation.org/blog/tax-refunds-one-big-beautiful-bill-act/, published 01/15/2026.
3 World Bank, Brueckner, Markus; Lederman, Daniel. Inequality and economic growth: the role of initial income (English). Policy Research working paper | no. WPS 8467 Washington, D.C. : World Bank Group. http://documents.worldbank.org/curated/en/574281528247194319, published 06/05/2018.
4 World Data Lab, The world is more equal than you think, https://blog.worlddatalab.com/wdl/the-world-is-more-equal-than-you-think, published 02/03/2026.
5 Brookings Institute, Immigration drives the nation’s healthy post-pandemic population growth, new census data show, https://www.brookings.edu/articles/immigration-drives-the-nations-healthy-post-pandemic-population-growth-new-census-data-show/, published 01/06/2025.
6 U.S. Bureau of Labor Statistics (BLS), Foreign-Born Workers: Labor Force Characteristics — 2024, https://www.bls.gov/news.release/pdf/forbrn.pdf, published 05/20/2025.
7 U.S. Census Bureau, Population Estimates Program. Data analysis and processing by USAFacts, https://usafacts.org/answers/is-the-population-growing-or-shrinking/country/united-states/, as of 12/31/2025.
8 U.S. Immigration and Customs Enforcement Removals Statistics, https://www.ice.gov/statistics. Data as of beginning of October 2020 through end of December 2024. Data is current as of January 2025.
9 Alexander Bick, Lower Immigration Projections Mean Lower Breakeven Employment Growth Estimates, St. Louis Fed On the Economy, https://www.stlouisfed.org/on-the-economy/2025/aug/lower-immigration-projections-mean-lower-breakeven-employment-growth, published 08/28/2025.
10 U.S. Census Bureau, American Community Survey (ACS) Public Use Microdata Sample (PUMS). Retrieved from https://www.census.gov/programs-surveys/acs/data.html, as of 12/31/2024.
11 Cato Institute, Immigrants’ Recent Effects on Government Budgets: 1994–2023, https://www.cato.org/white-paper/immigrants-recent-effects-government-budgets-1994-2023, published 02/03/2026.
12 International Monetary Fund (IMF), Spain: 2025 Article IV Consultation Staff Report, https://www.imf.org/en/-/media/files/publications/cr/2025/english/1espea2025001-print-pdf.pdf, published 6 June 2025. Banco de España, An estimation of the contribution of the foreign population in Spain to GDP per capita growth in the period 2022-2024, https://www.bde.es/f/webbe/SES/Secciones/Publicaciones/InformesBoletinesRevistas/BoletinEconomico/25/T2/Files/be2502-art10e.pdf, published 3 June 2025.
13 Catalyst, Caregiving pressures top factor pushing women out of the workforce, Catalyst finds, https://www.catalyst.org/about/newsroom/2026/caregiving-pressures-women-workforce, published 01/29/2026.
14 World Bank. 2026. Women, Business and the Law 2026: Benchmarking Laws for Jobs and Inclusive Growth. World Bank. doi:10.1596/978-1-4648-2196-7. License: Creative Commons Attribution CC BY 3.0 IGO.
15 Capital Economics, Long Run Outlook 2024: AI productivity boom tempered by protectionist threat, https://www.capitaleconomics.com/long-run-economic-outlook-2024-ai-productivity-boom-tempered-protectionist-threat, published 02/20/2024.
16 Challenger, Gray & Christmas, October Challenger Report: 153,074 Job Cuts on Cost-Cutting & AI, https://www.challengergray.com/blog/october-challenger-report-153074-job-cuts-on-cost-cutting-ai/, published 06/11/2025.
17 Wall Street Journal, CEOs Say AI Is Making Work More Efficient. Employees Tell a Different Story, https://www.wsj.com/lifestyle/workplace/ceos-say-ai-is-making-work-more-efficient-employees-tell-a-different-story-6613ce9d, published 01/21/2026.
18 Data Center Watch, https://www.datacenterwatch.org/q22025, as of 06/30/2025.
19 MacroEdge, Redeye Macro Note: The Latest on Data Centers, Shifting Market Sands, New Tariffs?, Portfolio Strategy Update, https://www.macroedge.world/p/redeye-macro-note-the-latest-on-data, published on Substack on 01/18/2026.
20 Synergy, Hyperscale Data Centers Hit the Thousand Mark; Total Capacity is Doubling Every Four Years, https://www.srgresearch.com/articles/hyperscale-data-centers-hit-the-thousand-mark-total-capacity-is-doubling-every-four-years, as of 07/12/2024.
21 Goldman Sachs Investment Research, The Macroeconomic Spillovers From AI Electricity Demand, https://www.gspublishing.com/content/research/en/reports/2026/02/11/cefdda9f-3b7c-4a53-9950-dfcfa3c6bbc2.html, published 02/11/2026.
22 IEA, Renewables 2025, IEA, Paris https://www.iea.org/reports/renewables-2025, License: CC BY 4.0, published 10/07/2025.
23 S&P Global, S&P Global's Top 10 Sustainability Trends to Watch in 2026, https://www.spglobal.com/sustainable1/en/insights/2026-sustainability-trends, published 01/14/2026.
24 Eurasia Group, Risk 10: The water weapon, https://www.eurasiagroup.net/live-post/risk-10-the-water-weapon, published 01/05/2026.
25 ABC Press Release, ABC: Construction Industry Must Attract 349,000 Workers in 2026 Despite Macroeconomic Headwinds, https://www.abc.org/News-Media/News-Releases/abc-construction-industry-must-attract-349000-workers-in-2026-despite-macroeconomic-headwinds, published 01/15/2026. The Washington Post, The AI Boom is so huge it’s causing shortages everywhere else, https://www.washingtonpost.com/technology/2026/02/07/ai-spending-economy-shortages/, published 02/07/2026.
26 CBAM refers to the EU’s Carbon Border Adjustment Mechanism, which applies an EU-equivalent carbon price to imported emissions-intensive goods; EU ETS is the EU Emissions Trading System, the bloc’s cap-and-trade regime that sets and enforces carbon pricing for major emitters; and EUDR is the EU Deforestation Regulation, which restricts the sale of commodities linked to deforestation by requiring companies to demonstrate fully traceable, deforestation-free supply chains.
27 Eurasia Group, Eurasia Group's Top Risks For 2026, https://www.eurasiagroup.net/issues/Top-Risks-2026, published 01/05/2026.
28 Munich Re, Climate change presses on: Devastating wildfires and intense thunderstorms exacerbate losses for insurers, https://www.munichre.com/en/company/media-relations/media-information-and-corporate-news/media-information/2026/natural-disaster-figures-2025.html, published 01/09/2025.
29 JP Morgan Private Bank, CoreLogic, S&P Global. Data as of 2024. Data indexed to 2019. CoreLogic data through 2023. S&P Global data for 2024. https://privatebank.jpmorgan.com/nam/en/insights/markets-and-investing/ideas-and-insights/how-climate-risk-and-losses-are-creating-high-prices-for-home-insurance, published 05/16/2025.
30 The Parliament Magazine, Sánchez walks a tightrope as Spain commits to NATO target, https://www.theparliamentmagazine.eu/news/article/snchez-walks-a-tightrope-as-spain-commits-to-nato-target, published 05/08/2025.
31 Just Security – Litigation Tracker, https://www.justsecurity.org/107087/tracker-litigation-legal-challenges-trump-administration/, accessed 03/05/2026.
Disclosures
The views expressed are those of the author and Brown Advisory as of the date referenced and are subject to change at any time based on market or other conditions. These views are not intended to be and should not be relied upon as investment advice and are not intended to be a forecast of future events or a guarantee of future results.
Past performance is not a guarantee of future performance, and you may not get back the amount invested.
The information provided in this material is not intended to be and should not be considered to be a recommendation or suggestion to engage in or refrain from a particular course of action or to make or hold a particular investment or pursue a particular investment strategy, including whether or not to buy, sell or hold any of the securities or funds mentioned. It should not be assumed that investments in such securities have been or will be profitable. To the extent that specific securities are mentioned, they have been selected by the author on an objective basis to illustrate views expressed in the commentary and do not represent all of the securities purchased, sold or recommended for advisory clients. This material is intended solely for our clients and prospective clients, is for informational purposes only and is not individually tailored for or directed to any particular client or prospective client.
The information contained herein has been prepared from sources believed reliable but is not guaranteed by us as to its timeliness or accuracy and is not a complete summary or statement of all available data. The information in this document has not been independently reviewed or audited by outside certified public accountants. The information provided is not intended to be a forecast of future events or a guarantee of future results. Past performance is not indicative of future performance.
Terms and Definitions:
Consumer Price Index (CPI) is a statistical measure of the average change over time in the prices paid by consumers for a representative basket of goods and services, commonly used as an indicator of inflation.