
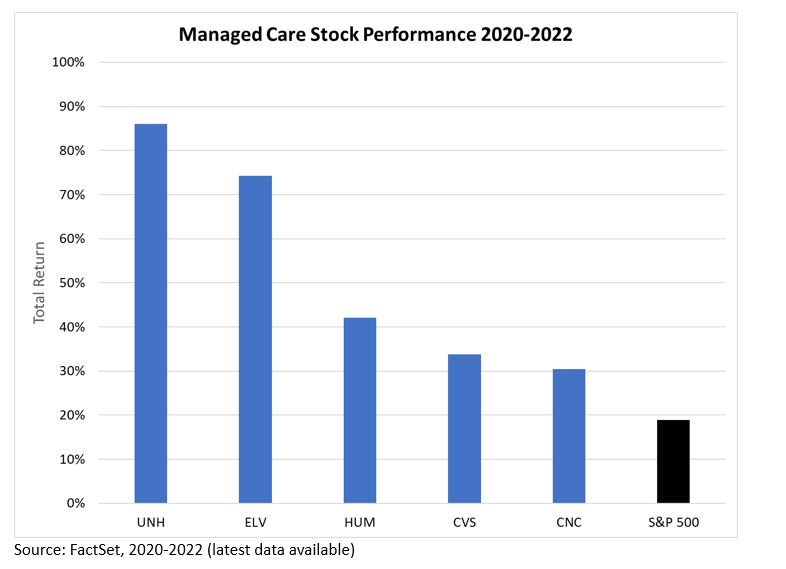
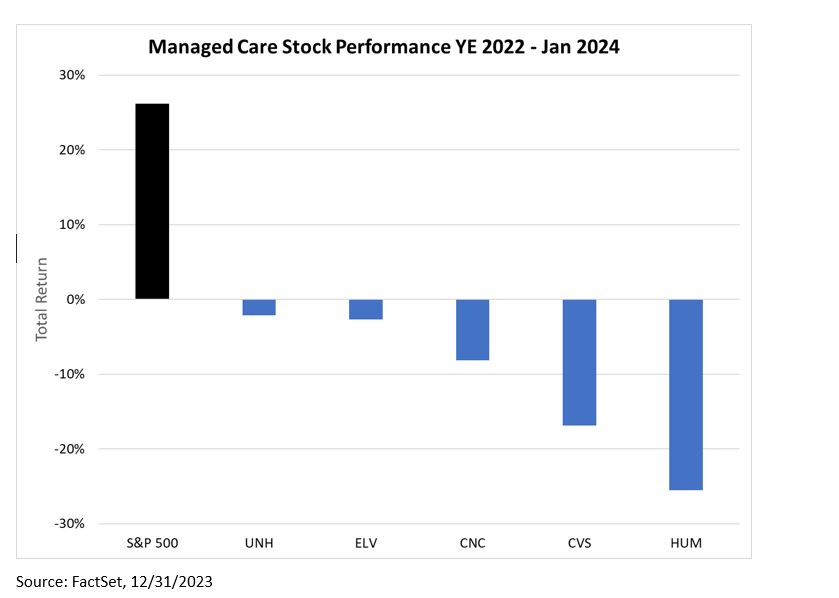
As good as the 2020-2022 period was for managed care company stocks, the past 13 months have been the complete opposite, particularly on a relative basis to the overall market. During the pandemic years, health insurers benefitted from a delay in non-urgent procedures due to hospital staffing shortages as well as concerns particularly among older Americans that hospitals and surgical centers were “too risky”. This led to lower costs against premiums earned, supporting strong earnings growth among public health insurers, especially those targeting Medicare Advantage (MA). Humana (HUM), which derives approximately 85% of its insurance premiums from this federal health insurance program for Americans 65 and older, saw its EPS climb more than 40% in 2022 from 2019 levels¹. The stock, like other managed care equities, significantly outperformed the S&P 500® Index during this period.
Source: Library of Congress
By mid-2023, the insurers began seeing more seniors catch up on surgeries they had delayed during the pandemic. UnitedHealth Group (UNH) first warned of this trend in June of last year at the Goldman Sachs conference. By 4q earnings season, elevated utilization across Medicare Advantage patients had impacted results; UNH reported a medical cost ratio (MCR) of 85% (suggesting a gross profit margin of 15%), higher than expectations. This bellwether of managed care companies wasn’t alone. HUM delivered an MCR of greater than 90% in 4q, while also guiding to a much higher MCR than expected for 2024 driving its EPS guide for the year to $16, roughly half of consensus estimates. This data point supercharged the trend of underperformance among managed care stocks since the start of 2023.
The current debate among managed care investors is whether HUM’s issues are company-specific or industry based, and whether the current trend of elevated MCR particularly related to Medicare Advantage is transitory or permanent. What is Medicare Advantage (MA)? Known as “Part C” in health care jargon, it is a one-step shopping program for health insurance among seniors, where the various components of Original Medicare (Part A – hospital care; Part B – doctor visits/outpatient services; Part D – prescription drugs) are all rolled together. It also offers additional services, such as vision and dental that are not part of Original Medicare. Lastly, it provides an annual limit to out of pocket expenses. The share of Medicare beneficiaries in MA plans has risen from less than 20% to roughly 50% over the past 15 years (now about 32 million people enrolled), while about two-thirds of MA enrollment is accounted for by the five largest insurers. MA has been a structural growth driver for managed care companies, explaining why UNH, HUM and Health Corporation (CVS) have such outsized exposure (at least 50% of insurance premiums earned) to this area².
While these companies have seen elevated utilization across MA patients in recent months, HUM is largely on an island in explaining the current industry challenges. HUM raised its 2024 MCR guidance by 200 bps (2%) on its 4q 2023 earnings call, pointing to “unprecedented challenges” in medical cost trends for the MA population, with MA undergoing a “complex and dynamic” period of change. Meanwhile, UNH, Centene Corporation (CNC) and Elevance Health (ELV) have not increased MCR expectations for 2024, while CVS did so only modestly this earnings season. It’s certainly possible that HUM’s outsized exposure to MA explains its draconian approach to 2024 guidance – messaging to the CMS (the federal agency with whom MA insurers contract) that if the second biggest MA insurer can barely make ends meet, a pricing (premium) adjustment clearly needs to occur.
With submission for MA bids for the next fiscal year due mid-year, these companies are truly only “guestimating” MCR ratios for 2024 – and it is conceivable that HUM is simply providing more conservative guidance than the other managed care companies. It’s also conceivable HUM has just gotten its MA utilization assumptions very, very wrong. Regardless, valuations across the sector have compressed since the start of 2023, especially relative to the broader market on concerns that industry conditions will remain more competitive for longer.
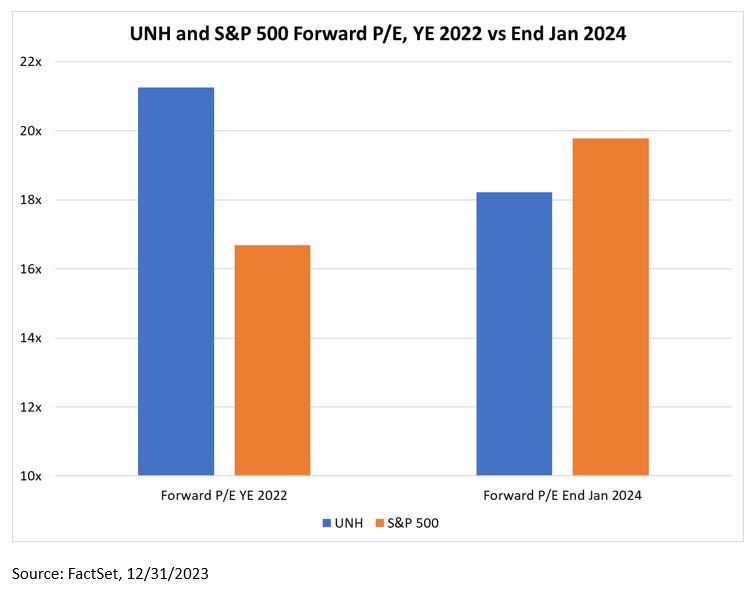
In the aftermath of the 4q 2023 HUM debacle, we have been adding to positions in UNH across some of our large-cap oriented strategies. UNH has a diversified benefits arm (focused on both commercial and government enrollment) along with Optum – a “provision of care” branch that includes a pharmacy, health savings accounts and a payment processor. The company’s scale, integrated services and immense data advantage over peers explain the company’s superior growth and historical valuation premium. It may also explain how the company saw the increase in MA utilization before others in mid-2023, and largely priced accordingly. Our strategies are attempting to take advantage of both a valuation dislocation and a potentially temporary blip in MA related profitability. As David Powell, co-Portfolio Manager of our Large Cap Sustainable Growth strategy mentioned, “the best thing about health insurance is that it reprices every year…the industry will figure it out.”
Thanks for reading, and remember to never skip a Beat Eric
1FactSet
2Centers for Medicare & Medicaid services.
The views expressed are those of the author and Brown Advisory as of the date referenced and are subject to change at any time based on market or other conditions. These views are not intended to be and should not be relied upon as investment advice and are not intended to be a forecast of future events or a guarantee of future results. Past performance is not a guarantee of future performance and you may not get back the amount invested. The information provided in this material is not intended to be and should not be considered to be a recommendation or suggestion to engage in or refrain from a particular course of action or to make or hold a particular investment or pursue a particular investment strategy, including whether or not to buy, sell, or hold any of the securities mentioned. It should not be assumed that investments in such securities have been or will be profitable. To the extent specific securities are mentioned, they have been selected by the author on an objective basis to illustrate views expressed in the commentary and do not represent all of the securities purchased, sold or recommended for advisory clients. The information contained herein has been prepared from sources believed reliable but is not guaranteed by us as to its timeliness or accuracy, and is not a complete summary or statement of all available data. This piece is intended solely for our clients and prospective clients, is for informational purposes only, and is not individually tailored for or directed to any particular client or prospective client.
Terms and Definitions:
Forward P/E Ratio: The Forward P/E Ratio is determined by dividing the price of the stock by the company's forecasted earnings per share.
The S&P 500® Index, an unmanaged index, consists of 500 stocks chosen for market size, liquidity, and industry group representation. It is a market-value weighted index (stock price times number of shares outstanding), with each stock's weight in the Index proportionate to its market value.
Standard & Poor’s, S&P®, and S&P 500® are registered trademarks of Standard & Poor’s Financial Services LLC (“S&P”), a subsidiary of S&P Global Inc.
All financial statistics and ratios are calculated using information from FactSet as of the report date unless otherwise noted. FactSet® is a registered trademark of FactSet Research Systems, Inc.