
Fast Reading
- Artificial intelligence and the ongoing energy shock are converging to make energy security a core sovereign risk factor, as conflict-driven supply pressures and rapidly growing data-center demand intensify the need for reliable, affordable, and locally available power.
- A country’s combination of energy resilience and AI infrastructure capacity will increasingly shape its growth and inflation outlook, creating clear distinctions between sovereign “AI haves” and “AI have-nots” and those with an energy advantage or disadvantage.
- This framework gives global fixed-income investors a new lens for assessing sovereign exposure to these rapidly evolving themes and the potential implications for currency and interest rates going forward.
AI may live in the cloud, but it runs on the grid.
The buildout of artificial intelligence is creating a new kind of energy demand: large, concentrated, power-hungry, and highly sensitive to the cost and reliability of electricity. The International Energy Agency expects global data-center electricity demand to more than double by 2030 to about 945 terawatt-hours, more than Japan’s total electricity consumption today. The United States accounts for the largest share of the increase, with electricity consumed for data centers likely to outpace the production of aluminum, steel, cement, chemicals, and all other energy-intensive goods combined by 2030.1 However, this is not solely a United States phenomenon. Countries around the world are scrambling to position themselves to benefit from the AI era.
Against this backdrop, the energy supply shock driven by the war in Iran should be viewed less as a temporary commodity event and more as an accelerant of a broader investment cycle within energy resilience. While initial policy responses have focused on shielding consumers from higher energy costs, governments are increasingly shifting toward demand reduction, energy security, and resilience measures. Access to reliable, affordable, and localized energy has become a strategic advantage and central to economic competitiveness and security.
At the same time, the AI infrastructure buildout is becoming increasingly inflationary. Data centers, grid upgrades, power generation, cooling systems, skilled labor, land, and critical inputs all require substantial capital investment, creating new demand pressures even as they support growth. Countries with energy resilience and credible AI infrastructure capacity may be better positioned to absorb these pressures while benefiting from stronger investment, improved external balances, and more durable growth. Countries without those advantages may face a more difficult mix of persistent inflation, weaker currencies, reduced policy flexibility, and limited participation in AI-linked growth.
AI and energy are now part of the same sovereign risk equation.
Sovereign Energy/AI Framework
Traditional energy shocks sort sovereigns into energy exporters and energy importers. The Iran war supply shock does that again, but the investment implications are now more complex because AI introduces a second axis of differentiation. The discussion around energy importers versus exporters must also incorporate the availability of alternative, localized energy sources, including renewables and nuclear power, which are becoming increasingly important to energy security in a more electrified world and have been accelerated by the AI infrastructure buildout.
China is a prime example. It has so far proven to be relatively resilient, reducing crude oil imports from roughly 11 million barrels per day before the war to an estimated 7.8 million barrels per day in May, at least in part due to large investments in electrification and clean energy in recent years, though other factors, including demand reduction, strategic oil reserve drawdowns, and increased reliance on coal, certainly play a role.2 We believe that investment is likely to continue after China launched its AI-Energy Action Plan in May, demonstrating the inextricable link between energy and AI. Beyond China, many government responses to the shock have included increased or accelerated clean energy investment across regions. Global exports of EVs, lithium-ion batteries, and solar from China surged 70% year over year in Q1 2026 to a record $21.9 billion, highlighting that these policy initiatives are translating into real investment.3
Understanding the interconnected nature of the current energy shock, the ongoing AI infrastructure buildout, and the increasing importance of energy sources beyond conventional fossil fuels, the following four-quadrant sovereign framework can help us assess potential implications for growth, inflation, FX, and rates.
The two axes are defined below:
- Energy position: Is the country a net energy importer or exporter? Beyond conventional energy, what is the availability of alternative, localized sources of energy, including renewables and nuclear power? Does the grid have the capacity to support electricity demand growth?
- Metrics: net oil/gas trade balance, clean electricity share, electricity mix and demand, power prices and grid constraints, grid reliability and reserve margins, data-center interconnection availability, energy subsidies, strategic inventories/reserves, and chokepoint exposure.
- AI position: Is the country able to capture AI-linked growth through one or more of the following channels: AI hardware exporter, data-center host, or cloud/digital infrastructure hub?
- Metrics: AI hardware/tech exports, semiconductor supply-chain role, AI-related export contribution to GDP, data-center FDI pipeline, model delivery/development, and cloud/hyperscaler presence.
Note: This categorization focuses specifically on the AI-related infrastructure buildout and does not incorporate adoption/productivity considerations, which are likely to come later.
Rates and FX Implications
Energy position | AI Haves | AI Have Nots |
|---|---|---|
Energy Advantage | Rates: Constructive higher-for-longer risk. Energy resilience limits imported inflation, but AI capex can keep growth and inflation firm through data-center investment, grid investment, construction, power demand, NIMBY policies, and skilled-labor bottlenecks, which may warrant structurally higher rates. FX: Generally supportive. Energy resilience plus AI-linked FDI, tech exports, data-center investment, or infrastructure inflows can support the currency. Appreciation may be muted if capex requires large equipment imports or windfalls are recycled offshore. | Rates: Less AI-driven inflation pressure. Policy depends more on commodity prices, fiscal behavior, and domestic demand. Energy windfalls can create overheating if spent aggressively, but otherwise may allow more policy flexibility. FX: Mostly driven by traditional interest rate, commodity, and external-balance-of-payment dynamics. Supportive if energy revenues or clean-power advantages improve external stability. Less supportive if governance is weak or windfalls are poorly managed. |
Energy Disadvantage | Rates: Highest hawkish-risk bucket. AI demand supports growth, but energy bottlenecks raise costs, strengthening the case for structurally higher rates. Central banks may face strong AI-linked sectors alongside fragile households and non-AI sectors, which may complicate the picture. Energy bottlenecks may also impede AI-linked growth potential. FX: Two-sided but fragile. AI exports, data-center FDI, or tech inflows can support the currency, but energy import bills, subsidy costs, and FX pass-through can dominate. The strongest cases are where AI inflows exceed the energy drag and where surpluses are retained domestically or recycled abroad. | Rates: Highest stagflation risk. Imported inflation, FX weakness, subsidy strain, and weaker real incomes dominate, with little AI-linked growth or external support. Defensive hikes or delayed cuts are more likely, especially in EM. FX: Most vulnerable bucket. Limited AI inflows, higher energy import bills, weaker growth, fiscal leakage, and deteriorating external balances can reinforce depreciation and inflation pass-through. |
Case Studies
The table below shows how a subset of our universe can be categorized according to this framework, and how applying this lens can help us better assess risks and opportunities in these countries, acknowledging that this is not a replacement for full, in-depth country-level analysis.
Energy position | AI Haves | AI Have Nots |
|---|---|---|
Energy Advantage | Australia*, Canada*, Finland, France, Norway*, Portugal, Spain, Sweden, United States*, China, Brazil*, Chile, Malaysia* | Denmark, New Zealand, Switzerland, Colombia |
Energy Disadvantage | Germany, Ireland, Israel, Japan, Mexico, Netherlands, Singapore, South Korea, UK | Austria, Belgium, Greece, Italy, Hungary, Poland, South Africa |
*Traditional energy exporters.
Spain (Energy Advantage/AI Have) vs. Italy (Energy Disadvantage/AI Have Not)
In addition to traditional energy exporters, as denoted with an *, several other countries benefit from large clean power capacity, putting them at an energy advantage. This partially shields them from the current energy shock and improves their ability to attract AI infrastructure investment. Spain, for instance, has been relatively better able to withstand the current energy shock compared to other EU peers, while simultaneously benefiting from recent data-center growth given the availability of low-cost and reliable electricity, primarily from renewables. This may help to reduce risk premia over time as the growth and fiscal positions improve. Italy, by contrast, falls on the opposite side of the spectrum. Its more expensive and volatile energy mix contributes to stagflation risk and reduces fiscal capacity.
Australia (Energy Advantage/AI Have) vs. New Zealand (Energy Advantage/AI Have Not)
Another interesting comparison is Australia versus New Zealand. Both economies are generally weaker, but Australia has a stronger AI ecosystem and energy resources, both conventional and renewable, and is benefiting from increasing data-center investment, with data-center investment making up 17% of private investment in Australia in Q1.4 Australia has already been raising rates and is in a generally higher rate environment, and if this level of investment is sustained, it may warrant structurally higher rates. New Zealand, on the other hand, has been in a lower rate regime. While the clean power advantage partially shields the economy from the energy shock, a limited AI ecosystem means it is unlikely to capture the same growth from the AI infrastructure buildout, leaving more room to keep rates lower and cut if and when inflation expectations are anchored.
South Korea (Energy Disadvantage/AI Have)
Moving over to Asia, the largest energy-importing region in the world, South Korea is a prime example of where AI-led growth has far outpaced any energy-related drag on the economy stemming from the current shock. Energy remains a constraint, but the policy response to the war has included measures to increase investment in clean energy, reflecting the growing importance to economic security, as it will be critical to executing on the country’s ambitious plans to double memory production capacity and expand its AI ecosystem.
Nonetheless, this puts South Korea in the most hawkish risk camp, with high energy prices and high AI-driven growth. It is important to note, however, that the growth impulse is highly concentrated, driven by the surge in memory prices that is boosting exports from just two companies, Samsung and SK Hynix, while the rest of the economy remains relatively fragile. Even within the semiconductor sector, there have been growing tensions between capital and labor as to who benefits from the chip boom, most recently with the Samsung wage negotiations. How and when this AI-linked growth spills over into the broader economy will be an increasingly important question for central bankers as they seek to strike a delicate balance between the “haves” and the “have nots.” This is similar to the K-shaped dynamics we have been monitoring in the United States and highlights that, even within the country-level AI Have/Have Not categories, there remains significant dispersion within countries as well.
CHART 1: AI VS. ENERGY POSITIONING
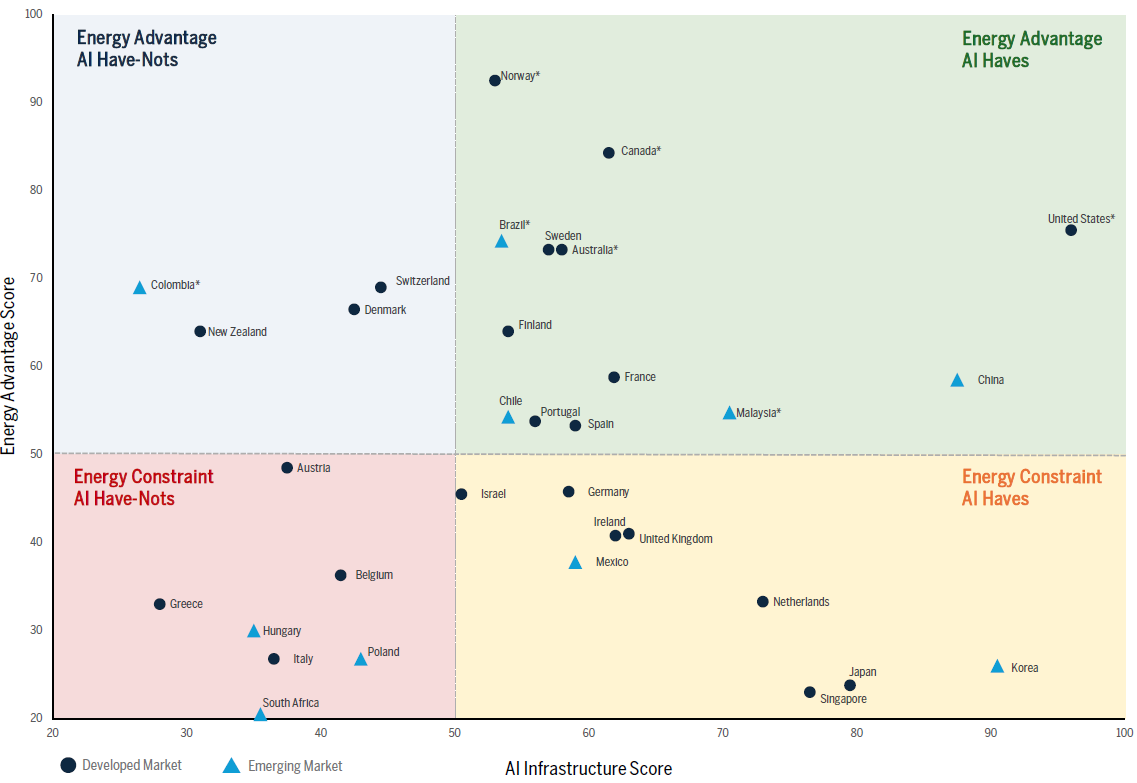
Source: Brown Advisory analysis, 24 July 2026. Scores are preliminary 0-100 composite assessments, rather than raw-data percentiles, based on weighted quantitative indicators and qualitative evidence across AI infrastructure exposure and energy advantage. *Asterisks denote a traditional fossil fuel or commodity-based energy advantage within the input universe.
Conclusion
This framework is a helpful starting point for understanding two important dynamics driving the global economy: AI and energy. That said, we recognize that it is an oversimplification and, as the dispersion in the chart above shows, the pace and scale of the macro impact will be quite different across countries. As such, this is only meant to provide an additional lens, not replace our in-depth country-level research. The conflict in the Middle East and the scale and pace of AI investment are both rapidly evolving, as will our assessment of the associated risks and opportunities.
- International Energy Agency. Energy and AI. IEA, April 10, 2025.
- Feng, Rebecca. “China Is Propping Up the World Economy by Importing a Lot Less Oil.” The Wall Street Journal, June 11, 2026.
- Ember. China Cleantech Exports Data Explorer, June 30, 2026.
- Mayger, James. “Record Spend on Data Centers Drives Australia Investment Growth.” Bloomberg, May 28, 2026.
Disclosures
The views expressed are those of the author and Brown Advisory as of the date referenced and are subject to change at any time based on market or other conditions. These views are not intended to be and should not be relied upon as investment advice and are not intended to be a forecast of future events or a guarantee of future results.
Past performance is not a guarantee of future performance, and you may not get back the amount invested.
The information provided in this material is not intended to be and should not be considered to be a recommendation or suggestion to engage in or refrain from a particular course of action or to make or hold a particular investment or pursue a particular investment strategy, including whether or not to buy, sell or hold any of the securities mentioned. It should not be assumed that investments in such securities have been or will be profitable. To the extent that specific securities are mentioned, they have been selected by the author on an objective basis to illustrate views expressed in the commentary and do not represent all of the securities purchased, sold or recommended for advisory clients. This material is intended solely for our clients and prospective clients, is for informational purposes only and is not individually tailored for or directed to any particular client or prospective client.
The information contained herein has been prepared from sources believed reliable but is not guaranteed by us as to its timeliness or accuracy and is not a complete summary or statement of all available data. The information in this document has not been independently reviewed or audited by outside certified public accountants.
The Global Industry Classification Standard (GICS) was developed by and is the exclusive property of MSCI and Standard & Poor’s. “Global Industry Classification Standard (GICS),” “GICS” and “GICS Direct” are service marks of Standard & Poor’s and MSCI.
“GICS” is a trademark of MSCI and Standard & Poor’s.
Terms and Definitions
CapEx, or capital expenditures: Funds used by a company to acquire, upgrade, and maintain physical assets such as property, plants, buildings, technology, or equipment.
Dispersion: The range of potential outcomes of investments based on historical volatility or returns.
Year-Over-Year: A method of measuring growth that compares a statistic, such as revenue in one time period, with the same time period one year earlier.