
In 1963, Bob Dylan warned us that the times, they are a-changin’—and while he wasn’t talking about capital markets, his words ring as true today for investors as they did for those growing up in the turbulent '60s. Market conditions may indeed be changing, and in ways that warrant a reassessment of portfolio positioning.
We tend to be strategic rather than tactical in our approach to investing, but a combination of recent fundamental developments and valuation changes has caused us to add a note of caution in conversations with clients and in the management of their portfolios. In essence, we think bonds are becoming increasingly attractive on a risk/reward basis, while stocks may be getting less so.
Just to be clear, this is not a sudden or abrupt shift in our thinking. We simply want to be sure that clients are aware of the incremental risk we have observed in the investing environment over the last 18-24 months. From an economic perspective, growth in the U.S. continues apace and has even accelerated somewhat, thanks in part to the corporate tax reductions enacted late last year. At the same time, the current expansion, now about nine years old, is among the longest on record. Although there are few signs of recession on the horizon, it’s inevitable that one will occur at some point. Cycles have yet to be eradicated from the economic landscape.
Incremental Equity Risks
Several evolving dynamics in the stock market, when taken together, suggest that risk levels have increased a bit over the last year or so:
- Valuations: To state the obvious, stock prices gained considerable ground during 2017 and are slightly higher so far in 2018. Even as the “E” (earnings) component of the P/E ratio has increased in 2018 thanks to the strong economy and tax cuts, the “P” (price) component has moved up more, and valuations have risen perceptibly. The S&P 500® Index is now priced at about 17 times forward 12 months’ estimated earnings. While this valuation level is nowhere near the extremes of recent bull market peaks, it is 5-10% above long-term historical averages. Using price/cash flow as a measure, valuations are more like 20% higher than normal.
- Concentration: Much of the U.S. equity market’s gain since early 2017 has been concentrated in a relatively small number of sectors and specific stocks. In general, growth stocks have meaningfully outperformed the rest of the market, and technology stocks in particular have led the way. In the 18 months ending June 30, 2018, the Russell 1000® Growth Index rose 39.7%, compared to the Russell 1000® Value Index’s increase of 11.7%. The well-publicized FAANG stocks (Facebook, Apple, Amazon, Netflix and Google’s parent company, Alphabet) have accounted for a remarkable 30.6% of the gain in the Russell 1000 Growth Index over this same time period.
- Correlations: Less widely recognized has been the reduced tendency of stocks to move together—a behavior known as correlation. For much of the current bull market’s history, the spread between the best- and worst-performing sectors was comparatively narrow, but in more recent times, this pattern has shifted. In the first six months of this year, for example, technology stocks as a group gained 10.9%, while the telecommunications sector was down 8.4%. Taking a more granular look at subsectors, internet retail stocks were up 48.2%, while packaged foods dropped 10.9%.
More broadly, global crosscurrents are clouding the outlook and adding to uncertainty. Central banks across the globe are in various stages of withdrawing monetary support after many years of reflating. International trade, long a positive influence on growth, is now being threatened by the imposition of tariffs around the world. Labor markets in the U.S. are surprisingly tight, yet wages have not yet risen sufficiently to cause consumer spending to accelerate markedly. Oil prices are up sharply in the last year and have roughly doubled from their lows of two years ago, but many other commodities are closer to their 52-week lows than their highs. Although largely subdued of late, inflation lurks as a potential disrupter to growth.
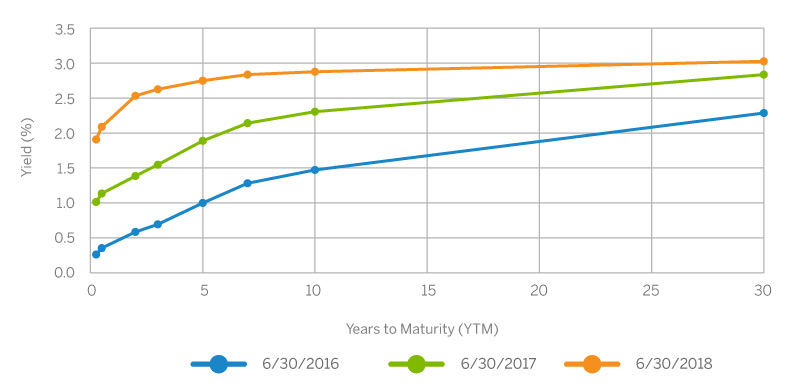
Exhibit 1: U.S. Treasury Yield Curves Over Time
Federal Reserve rate hikes shifted yields higher and flattened the curve.
Source: Bloomberg.
In spite of what some would argue is an atmosphere of increasingly elevated risk, many investors are stretching for incremental returns by adding to positions in the most richly valued stocks or in illiquid investments in asset classes with inflated valuations. Adding risk to portfolios at this stage in the economic cycle does not seem like a prudent strategy to us. Rather than making larger equity bets, investors in hedge funds, who tend to be among the most sophisticated institutional and private clients, are deliberately reducing their exposure to equity “beta” or volatility. Traditional long/short equity funds have seen redemptions in recent months, while credit and event-driven funds (whose returns are largely independent of the equity markets) have seen meaningful inflows.
Opportunity to Rebalance?
It’s anyone’s guess as to how equity markets will perform over the next year or two, but as the bull market ages, we think it makes sense to start dialing back portfolio risk levels. A primary mechanism for managing risk is rebalancing, with particular focus on the role of bonds in the portfolio. Without intending to forecast, it seems only sensible to assume that equity market returns over the next several years are unlikely to be as robust as they’ve been during the long bull market, or that they will equal their long-term historical average of 8-10%. Our working assumption in constructing portfolios today is 6-7%. (Let’s hope we’re wrong, but we prefer to be surprised on the upside.)
At the same time, with rising interest rates, bond returns are increasingly compelling. While the role of bonds since the financial crisis of 2008-09 has been more about reducing portfolio risk and less about producing incremental profit (although returns have generally been positive), that role may be changing in favor of relative returns.
In the U.S., bond yields are still below average historical levels, but they are well above post-recession lows and gradually rising. To gain a sense of where yields could go over time, it can be useful to look at very long-term trends. A December 2017 working paper of the National Bureau of Economic Research examines the rates of return between 1870 and 2015 in several asset classes across 16 developed economies. Based on this very broad data set, the real return for bonds (i.e., return net of inflation) was slightly more than 2% and for equities was just under 7%. Using the 10-year U.S. Treasury bond (currently yielding about 3%) as a barometer and assuming inflation at roughly 2% in today’s economy, the real return is about 1%. A portfolio that includes bonds of varying quality and duration (such as the Brown Advisory Core Fixed Income Strategy) can yield more like 4% without compromising meaningfully on quality. While real returns in the 1-2% range are still low relative to the past, they have been slowly rising and, importantly, are meaningfully higher than the real yields in most other developed nations.
Based on its own statements, the Fed is intent on raising interest rates to head off what it sees as a threat of higher inflation, given tight labor markets and a rise in certain input costs. In addition, restoring rates to more “normal” levels would give it room to once again reduce rates as a strategy to stimulate the economy when the next recession occurs. If the Fed continues along this path (and futures markets suggest that investors believe it will), short-term rates will trend higher. Long-term rates, however, remain low by historical standards. It’s not totally clear why this is the case, but it tends to suggest that bond investors are wary of a slowdown in the economy despite rather strong economic indicators. Further, the supply of long-duration instruments is also artificially low, as the Fed has a huge portfolio that it purchased during the recession in order to stave off the crisis. As it unwinds that position over time, the prices of long-dated bonds could be pressured by incremental supply, sending their yields higher.
The result of this combination of factors is that the yield curve for taxable bonds is almost “flat”—that is, there is relatively little difference between short- and long-term interest rates. (In municipal bonds, the yield curve is steeper.) Using U.S. Treasury obligations as a gauge, the difference in yield, or “spread,” between a two-year and a 30-year bond is roughly 40 basis points (a basis point is one one-hundredth of a percent) and between a 10-year and 30-year bond the spread is only about 10 basis points. When long rates fall below short-term ones, the yield curve is said to be “inverted”—a condition that typically occurs in weak economic circumstances. According to research by the San Francisco Fed, an inverted yield curve has preceded every one of the nine recessions that have occurred since 1955, with only one false positive reading during that period. Although the curve is not inverted now, some observers are concerned that it may invert soon, thereby signaling that a recession may be on the horizon. The potential for inversion is not a reason in and of itself to make changes in asset allocation, but the combination of higher short-term yields and additional equity market uncertainty does affect our thinking about portfolio positioning.
Risks in Bonds
In attempting to reduce portfolio risk by shifting assets from equities to bonds, it’s important to recognize that bonds carry risks of their own. At this stage of the economic cycle, a primary concern on most investors’ minds is the prospect of rising interest rates, which would be a negative for all but the shortest-duration bonds. As the cycle matures and the labor market continues to tighten, inflation is becoming an increasingly likely possibility, one that the Fed takes very seriously. Beyond the U.S., central banks around the world are also in various stages of withdrawing stimulus as their respective countries or regions show signs of recovering on their own. Largely because the U.S. recovery is more advanced than the rest of the developed world, interest rates here are higher, but others are catching up. Many non-U.S. investors currently find our rates more attractive than their own and have shifted some of their funds into U.S. bonds. In addition, last year’s tax overhaul resulted in the repatriation of substantial cash balances held abroad by a number of large U.S. corporations. These sources of demand have had the effect of strengthening the dollar but have also kept U.S. bond prices higher and interest rates lower than they might otherwise have been. If this trade becomes less advantageous because of rising rates abroad, it could cause our interest rates to edge higher.
The prospect of rates rising higher causes us to manage bond portfolios a bit differently. For example, we are emphasizing strategies consistent with low durations in large part by utilizing floating-rate bonds or bonds that return principal quickly. By doing this, we have more opportunity to reap the benefits of higher rates without suffering undue price erosion. (Variable-rate bonds are less volatile in price than fixed-rate ones because their yield, rather than price, adjusts to reflect changes in the interest rate environment.) In any case, it’s important to recognize that yield is a more important driver of bond returns than price. Over time, a bond’s income stream more than offsets any erosion of principal that results from the negative impact of rising rates. Because of this, bonds have produced positive returns since 2013—a period in which interest rates have broadly doubled.
The second major risk in today’s bond markets is the possibility of default if economic conditions worsen. In recent years, companies have added considerably to their debt burdens, in the interest of deploying capital efficiently (sometimes at the urging of activist shareholders) and because interest expense is still tax-deductible. The result has been a growing number of bonds rated as “junk” by various rating agencies. States and municipalities have also taken on more debt. Even within the investment-grade category, bond ratings have declined over the last several years as financial leverage has generally risen. As an indication, the percentage of corporate bonds rated BBB has grown from 29% in 2000 to 53% today, according to Bloomberg. Another measure of risk is the spread between the yield on corporate debt (including high-yield or “junk” debt) and treasury bonds (considered “riskless”) of the same maturity. Again, that spread is currently at multiyear lows, meaning that investors are getting paid less for the risk they are taking in various types of bonds.
Managing Bond Risk
The risks of rising rates and a higher incidence of defaults can be managed. As noted, we like to keep maturities relatively short or invest in variable-rate bonds in order to avoid the volatility that comes from changes in the interest rate environment. Default risks can also be managed through the use of fundamentally based credit research. Because of the large number of taxable and nontaxable bond issues, bonds tend to be less intensely researched than stocks. As a result, our analysts are able to identify opportunities to take advantage of inefficiencies in the market, capturing incremental yield without taking on commensurate fundamental risk. Adding mispriced, lower-rated bonds to a portfolio can produce incremental yield and total return.
Exhibit 2: U.S. Bond Returns Since 2013
Despite rates rising significantly since 2013, bonds have produced solidly positive returns.
Annualized Returns, 04/30/2013-06/30/2018
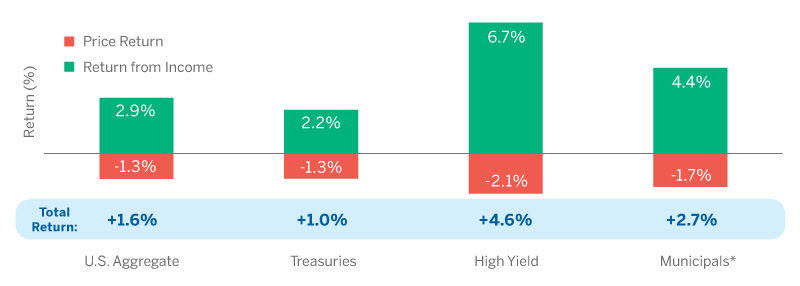
Source: Bloomberg, using ICE BofAML Benchmarks. ICE BofAML US Broad Market Index for U.S. Aggregate. ICE BofAML US Treasury & Agency Index for Treasuries. ICE BofAML US High Yield Index for High Yield. ICE BofAML US Municipal Securities Index for Municipals. *Note: Returns do not take into account the impact of taxes on taxable bond returns with the exception of municipals, which are tax-exempt.
The second approach to mitigating overall portfolio risk is one that we advocate as an ongoing strategy: keeping ample cash on hand to meet the need for withdrawals from the portfolio, whether for living expenses or some other purpose. The amount of cash and number of years of spending varies according to individual circumstances, but clients should never be forced to sell assets at depressed prices to meet cash needs. We see this period in the markets as a particularly good time to review the need for liquidity.
In summary, the combination of rising equity valuations and increasingly attractive bond yields has created a timely opportunity to re-examine asset allocation. Although the long-term outlook for stocks hasn’t changed, it’s been a long time since fixed income returns have been as competitive with equities as they are today, to say nothing of the generally lower risks associated with bonds. It’s important to note here that we’re not recommending wholesale changes in asset allocation. We are not market timers and have no particular insight into near-term movements in the markets. We are, however, suggesting a review of portfolio positioning and adjustments at the margin where it makes sense. And, as always, maintaining sufficient liquidity is the key to allowing portfolios to withstand volatility in the markets, whenever it occurs. ![]()
The views expressed are those of Brown Advisory as of the date referenced and are subject to change at any time based on market or other conditions. These views are not intended to be and should not be relied upon as investment advice and are not intended to be a forecast of future events or a guarantee of future results. Past performance is not a guarantee of future performance and you may not get back the amount invested.
The information provided in this material is not intended to be and should not be considered to be a recommendation or suggestion to engage in or refrain from a particular course of action or to make or hold a particular investment or pursue a particular investment strategy, including whether or not to buy, sell, or hold any of the securities or asset classes mentioned. It should not be assumed that investments in such securities or asset classes have been or will be profitable. To the extent specific securities are mentioned, they have been selected by the author on an objective basis to illustrate views expressed in the commentary and do not represent all of the securities purchased, sold or recommended for advisory clients. The information contained herein has been prepared from sources believed reliable but is not guaranteed by us as to its timeliness or accuracy, and is not a complete summary or statement of all available data. This piece is intended solely for our clients and prospective clients, is for informational purposes only, and is not individually tailored for or directed to any particular client or prospective client. The Russell 1000® Growth Index measures the performance of the large-cap growth segment of the U.S. equity universe. It includes those Russell 1000® Index companies with higher price-to-book ratios and higher forecasted growth values. The Russell 1000® Growth Index is constructed to provide a comprehensive and unbiased barometer for the large-cap growth segment. The Index is completely reconstituted annually to ensure new and growing equities are included and that the represented companies continue to reflect growth characteristics. The Russell 1000® Value Index is constructed to provide a comprehensive and unbiased barometer for the large-cap value segment. The Index is completely reconstituted annually to ensure new and growing equities are included and that the represented companies continue to reflect value characteristics. Russell 2000®, Russell 1000® Growth, Russell 1000®, Russell 1000® Value, Russell 2000® Growth, Russell 2000® Value, Russell 3000®, Russell 1000® Pure Value and Russell 1000® Pure Growth when related to the Russell indexes are trademarks of the . RussellLondon Stock Exchange Group of companies.
The S&P 500® Index represents the large-cap segment of the U.S. equity markets and consists of approximately 500 leading companies in leading industries of the U.S. economy. Criteria evaluated include market capitalization, financial viability, liquidity, public float, sector representation and corporate structure. An index constituent must also be considered a U.S. company. Standard & Poor’s, S&P®, and S&P 500® are registered trademarks of Standard & Poor’s Financial Services LLC (“S&P”), a subsidiary of S&P Global Inc.
The ICE BofAML US Broad Market Index tracks the performance of US dollar denominated investment grade debt publicly issued in the US domestic market, including US Treasury, quasi-government, corporate, securitized and collateralized securities. With the exception of local currency sovereign debt, qualifying securities must have an investment grade rating (based on an average of Moody’s, S&P and Fitch). The ICE BofAML US Treasury & Agency Index tracks the performance of US dollar denominated US Treasury and non-subordinated US agency debt issued in the US domestic market. Qualifying securities must have an investment grade rating (based on an average of Moody’s, S&P and Fitch). The ICE BofAML US High Yield Index tracks the performance of US dollar denominated below investment grade corporate debt publicly issued in the US domestic market. Qualifying securities must have a below investment grade rating (based on an average of Moody’s, S&P and Fitch), at least 18 months to final maturity at the time of issuance, at least one year remaining term to final maturity as of the rebalancing date, a fixed coupon schedule and a minimum amount outstanding of $250 million. The ICE BofAML US Municipal Securities Index tracks the performance of US dollar denominated investment grade tax-exempt debt publicly issued by US states and territories, and their political subdivisions, in the US domestic market. Qualifying securities must have at least one year remaining term to final maturity, at least 18 months to final maturity at the time of issuance, a fixed coupon schedule and an investment grade rating (based on an average of Moody’s, S&P and Fitch). Intercontinental Exchange, Inc. (NYSE:ICE) operates a leading network of exchanges and clearing houses. ICE’s exchanges and clearing houses, which include the New York Stock Exchange, serve global commodity and financial futures and equities markets. The New York Stock Exchange is the world leader in capital raising and equities trading. ICE is a leading provider of data services across global markets. Trademarks of ICE and/or its affiliates include Intercontinental Exchange, ICE, ICE block design, NYSE, New York Stock Exchange, Interactive Data and Trayport. BLOOMBERG is a trademark and service mark of Bloomberg Finance L.P.