
In the heart of Manhattan’s Hell’s Kitchen sits Churrascaria Plataforma, a Brazilian steakhouse famous for its rodizio all-you-can-eat experience. Once seated, patrons are handed a coaster, green on one side and red on the other. Servers in traditional gaucho-style uniforms circulate the dining room armed with sword-length skewers and carving knives in search of coasters green-side up. Upon each skewer is a different premium cut of meat – picanha (top sirloin cap), peppered ribeye, lamb chops, filet, or short rib, among others. If a patron’s coaster is green, the gauchos will swiftly appear, angling their skewer over the corresponding plate to shave off another salt-crusted helping of excess. By the time most surrender their coaster to red, they have overindulged to the point of indigestion.
It was here, more than a quarter of a century ago, that I learned the uncomfortable lesson that too much of a good thing can end, um, poorly. Surrounded by carnivorous friends and too many caipirinhas, the beads of perspiration on my brow eventually broke the spell of gluttonous goodness. This eventuality had nothing to do with the quality of the tableside bounty, but the cadence. The gauchos frequented my plate faster than my stomach could signal ‘satiation’ to my brain.
Around this time, public equity investors were learning a similar lesson. In the late 1990s, the internet was real, transformative, and underappreciated in terms of cumulative influence on society. Initially, a handful of companies went public in high-profile IPOs. Netscape, Yahoo, and eBay all experienced first-day gains of greater than 100%. However, by the end of the decade, public markets became flooded with a continuous rodizio of internet companies going public. Investors eventually turned their coasters from green to red following a frenzy of hundreds of IPOs. Within years, the majority disappeared through bankruptcy (Pets.com), delisting (theGlobe.com), or distressed sale (Egghead.com).
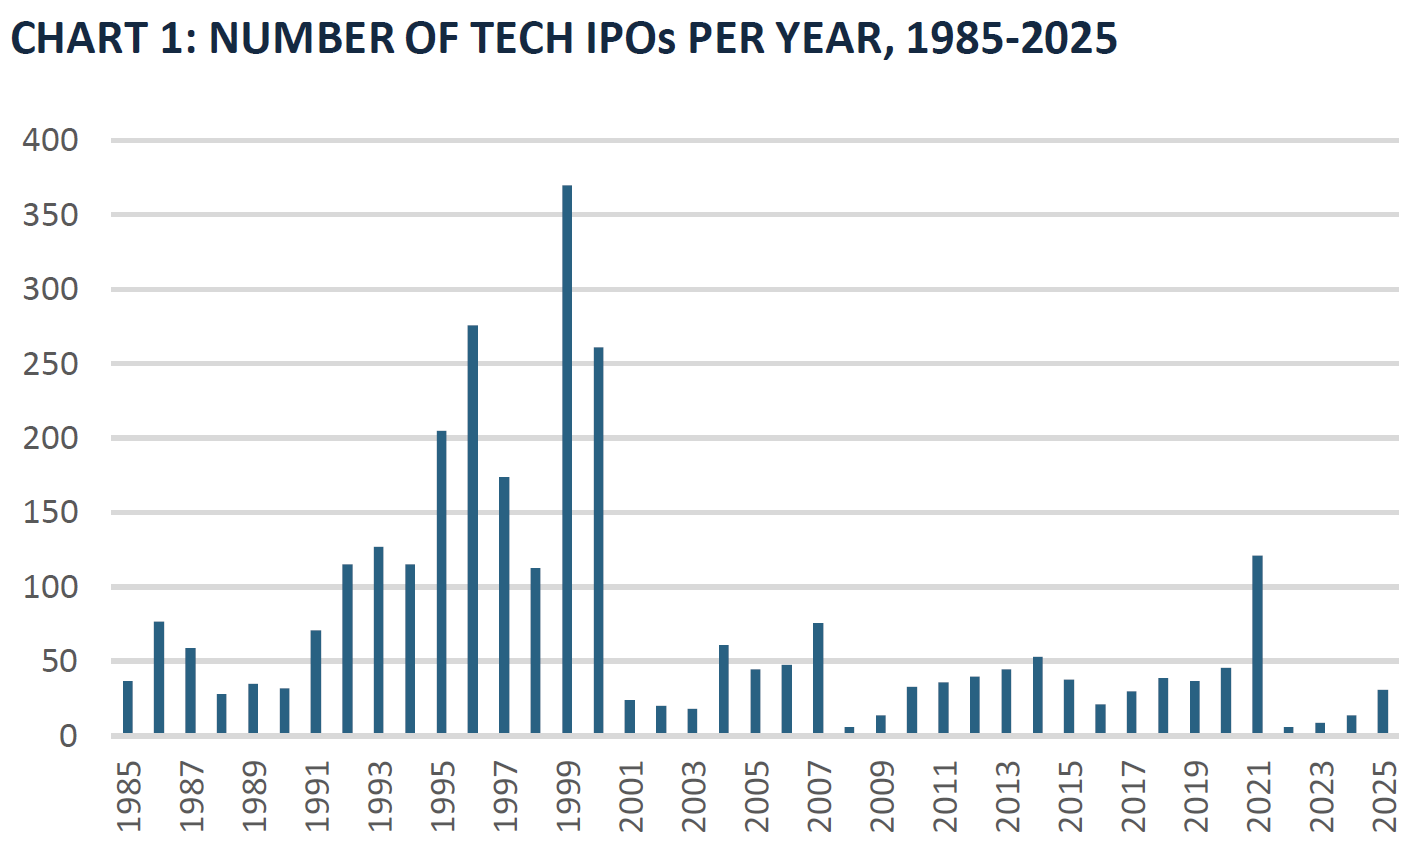
Note: Tech stocks include internet-related stocks plus other tech areas including telecom.
Source: Jay R. Ritter, University of Florida as of 12/31/2025.
This pattern is not unique to the dot-com era. Innovation cycles often begin with a relative scarcity of investable exposure and conclude with a relative scarcity of capital availability against a stretched opportunity set. In the late 18th century, the development of canals in the U.K. dramatically lowered transport costs and helped usher in the Industrial Revolution by moving heavy materials such as coal cheaply and reliably. The Bridgewater Canal opened in 1761, cutting in half the cost of coal in Manchester and demonstrating that transport infrastructure could unlock industrial demand. By the 1790s, the ‘canal trade’ became a speculative market, with the quantity of proposed and authorized projects overwhelming the amount of capital available to invest. While the precise failure rate is hard to pin down, a significant minority of projects did not reach completion.
Public equity investors today are at risk of encountering a similar conundrum to my experience in Hell’s Kitchen, although their source of discomfort will not be South American cuisine. The combination of primary capital raising and float creation by just a handful of companies could inject well more than $1 trillion of newly tradable or indexable artificial intelligence (AI)-related public equity into markets over the next 12-18 months.1 Whether investors can digest this surge in supply with an already super-sized allocation to AI remains unknown.
Space Exploration Technologies (“SpaceX”), the most anticipated IPO of the modern U.S. tech era, began trading on June 12 with an initial float (publicly traded equity) of $75 billion at an overall valuation slightly above $1.75 trillion. The stock (“SPCX”), closed up more than 19% that day, placing its float at close to $90 billion, its market capitalization above $2 trillion, and Elon Musk’s personal net worth at an astronomical $1.1 trillion according to Forbes. After lockups and other restrictions expire and secondary offerings occur, the company’s float could become much larger, potentially approaching $500 billion if the company’s valuation holds and 25% of shares trade publicly. While neither OpenAI nor Anthropic have yet to file a public S-1, reports suggest valuations of close to $1 trillion for each once they go public. We cannot predict the size of these IPOs, nor the float once lockup periods expire. However, it would not be shocking for these three companies alone to collectively create close to $1 trillion of incremental public equity supply by the end of next year. Other AI-related IPOs such as Cerebras (May 2026) and potentially Databricks could further increase supply of public equity across the AI theme.
In addition, Alphabet recently announced an $85 billion equity capital raise to expand its AI infrastructure and compute capabilities. Meta is potentially exploring equity financing for AI infrastructure as well, although the company recently dismissed such action as ‘speculation’. Earlier this month, Oracle confirmed its plan to issue $20 billion in at-the-market equity during its 2027 fiscal year. While the largest hyperscalers (Alphabet Inc Class C (GOOG), Amazon.com Inc (AMZN), Microsoft Corp (MSFT), Meta Platforms Inc (META)) have little to no net debt today, they are at risk of generating negative free cash flow due to heavy AI-related investment. Equity offerings could further preserve their balance sheet optionality in the event this investment cycle is more pronounced and longer than expected.
The S&P 500® Index has twenty-five constituents with a float above $100 billion that I consider heavily involved in the AI trade. These include hyperscalers, chip manufacturers, semi-cap equipment and networking companies, as well as industrial equipment suppliers. Collectively, they carry a float of $23 trillion as of June 12, and through May account for 80% of the S&P 500® Index’s return to date. If we exclude Microsoft and Meta, which have both generated negative returns this year, the cumulative float drops to $19 trillion while the contribution to the S&P 500® Index’s year-to-date return climbs to 86%. Thus, through the first five months of 2026, market leadership has remained exceptionally narrow, with gains concentrated among just two dozen perceived AI winners.
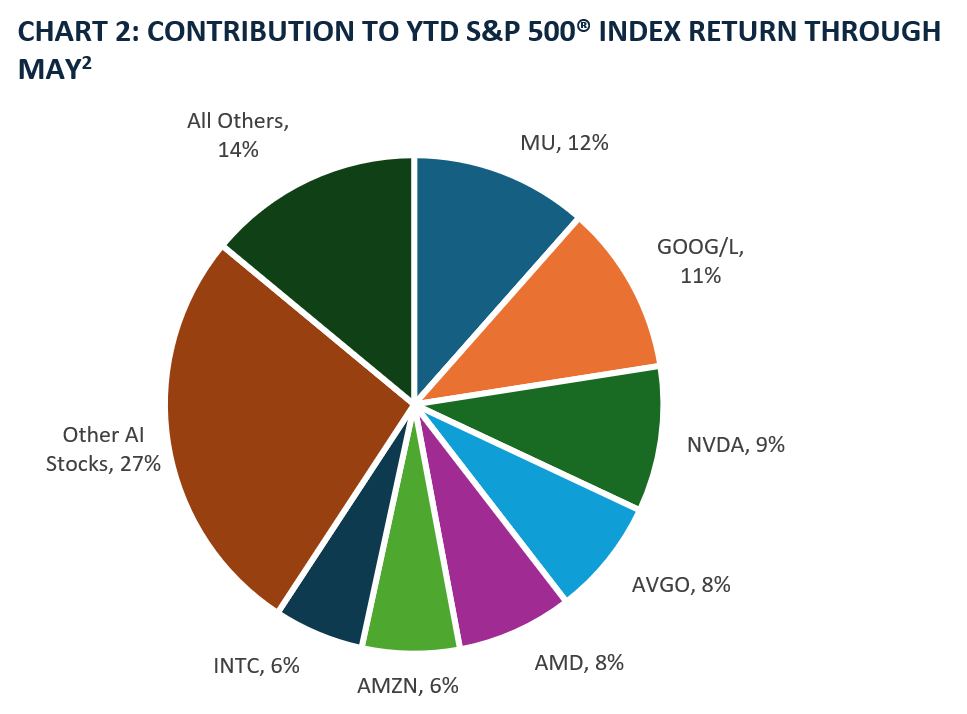
Note: “Other AI Stocks” include ADI, AMAT, ANET, CSCO, DELL, GEV, GLW, KLAC, LRCX, ORCL, QCOM, SNDK, STX, TXN, VRT, WDC.*
Source: FactSet as of 05/31/2026
Can the public market smoothly digest an ample serving of $1+ trillion in AI shares over the next 12-18 months, beyond the hefty investment of $19 trillion in market capitalization across this theme to date? Are we once again approaching a point in the innovation cycle where the need for equity capital overwhelms investor appetite? At the very least, the magnitude of incremental supply over such a brief period could dilute the scarcity premium in existing AI winners. Food for thought as investment banks replenish their skewers and search for investors with coasters that remain on green.
Thanks for reading, and remember to never skip a Beat – Eric
1 Brown Advisory calculations.
2 Chart may not equal 100% due to rounding.
Source: FactSet®. FactSet is a registered trademark of FactSet Research Systems, Inc.
The views expressed are those of the author and Brown Advisory as of the date referenced and are subject to change at any time based on market or other conditions. These views are not intended to be and should not be relied upon as investment advice and are not intended to be a forecast of future events or a guarantee of future results. Past performance is not a guarantee of future performance and you may not get back the amount invested. The information provided in this material is not intended to be and should not be considered to be a recommendation or suggestion to engage in or refrain from a particular course of action or to make or hold a particular investment or pursue a particular investment strategy, including whether or not to buy, sell, or hold any of the securities mentioned. It should not be assumed that investments in such securities have been or will be profitable. To the extent specific securities are mentioned, they have been selected by the author on an objective basis to illustrate views expressed in the commentary and do not represent all of the securities purchased, sold or recommended for advisory clients. The information contained herein has been prepared from sources believed to be reliable but is not guaranteed by us as to its timeliness or accuracy, and is not a complete summary or statement of all available data. This piece is intended solely for our clients and prospective clients, is for informational purposes only, and is not individually tailored for or directed to any particular client or prospective client.
An investor cannot invest directly into an index.
Sectors are based on the Global Industry Classification Standard (GICS®) and “GICS” are service makers/trademarks of MSCI and Standard & Poor’s.
Terms and Definitions
The S&P 500® Index is a capitalization weighted index of 500 stocks that is designed to measure performance of the broad domestic economy through changes in the aggregate market value of 500 stocks representing all major industries. Index returns assume reinvestment of dividends and do not reflect any fees or expenses. An investor cannot invest directly into an index. Benchmark returns are not covered by the report of the independent verifiers. Standard & Poor’s, S&P®, and S&P 500® are registered trademarks of Standard & Poor’s Financial Services LLC (“S&P”), a subsidiary of S&P Global Inc.
Free cash flow (FCF) represents the cash a company generates after cash outflows to support operations and maintain its capital assets. Unlike earnings or net income, free cash flow is a measure of profitability that excludes the non-cash expenses of the income statement and includes spending on equipment and assets as well as changes in working capital